Fig. 5
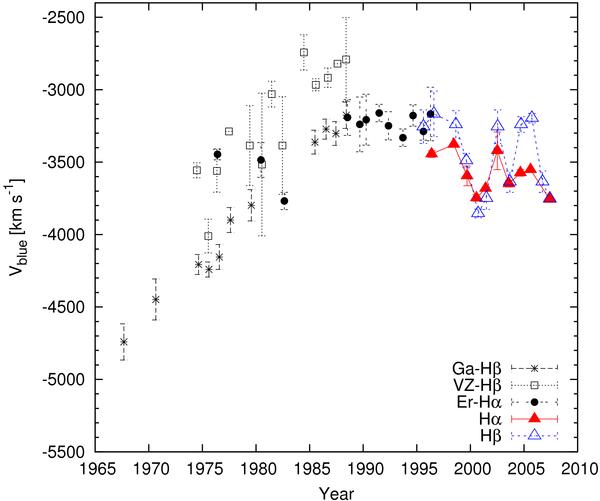
Annual averaged radial velocities of the blue peak. The different symbols represent: stars – the Hβ data from Gaskell (1996), open squares – the Hβ measurements given in Veilleux & Zheng (1991), year-averaged to match other data, full circles – the Hα data from Eracleous et al. (1997), open and full triangles – our data for Hβ and Hα, respectively.
Current usage metrics show cumulative count of Article Views (full-text article views including HTML views, PDF and ePub downloads, according to the available data) and Abstracts Views on Vision4Press platform.
Data correspond to usage on the plateform after 2015. The current usage metrics is available 48-96 hours after online publication and is updated daily on week days.
Initial download of the metrics may take a while.