Fig. 17
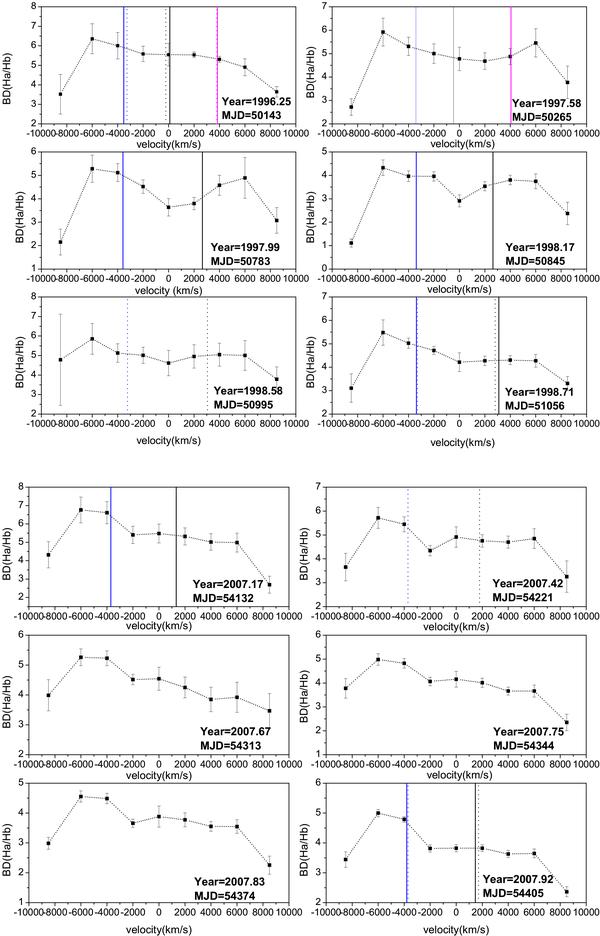
Variations in the Balmer decrement (BD = Hα/Hβ) as a function of the radial velocity for month-averaged spectra of 3C 390.3. Upper panel represents BD from the period of 1995–1998, and bottom panel from 2007. These two panels are chosen because they represent the characteristic behavior of BD vs. velocity. The abscissa (OX) indicates the radial velocities with respect to the narrow components. The position of the blue, central and red peaks are marked with blue, black and pink line, for Hα (solid line) and Hβ (dashed line). The rest of the panels are available electronically only.
Current usage metrics show cumulative count of Article Views (full-text article views including HTML views, PDF and ePub downloads, according to the available data) and Abstracts Views on Vision4Press platform.
Data correspond to usage on the plateform after 2015. The current usage metrics is available 48-96 hours after online publication and is updated daily on week days.
Initial download of the metrics may take a while.