Free Access
Fig. 15
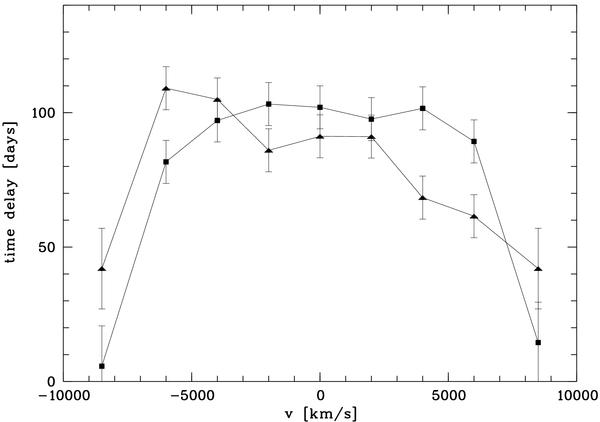
Time delay of the individual line segments of Hβ for the first half of the observing period from 1995–2002 (filled squares) and for the second half from 2003–2007 (filled triangles) with respect to the continuum light curve in velocity space.
Current usage metrics show cumulative count of Article Views (full-text article views including HTML views, PDF and ePub downloads, according to the available data) and Abstracts Views on Vision4Press platform.
Data correspond to usage on the plateform after 2015. The current usage metrics is available 48-96 hours after online publication and is updated daily on week days.
Initial download of the metrics may take a while.