| Issue |
A&A
Volume 528, April 2011
|
|
|---|---|---|
| Article Number | A126 | |
| Number of page(s) | 5 | |
| Section | Stellar structure and evolution | |
| DOI | https://doi.org/10.1051/0004-6361/201016248 | |
| Published online | 14 March 2011 | |
A model for the upper kHz QPO coherence of an accreting neutron star
1 National Astronomical Observatories,
Chinese Academy of Sciences 100012 Beijing PR China
e-mail: This email address is being protected from spambots. You need JavaScript enabled to view it.
; This email address is being protected from spambots. You need JavaScript enabled to view it.
2 Department of
Physics and Tsinghua Center for Astrophysics, Tsinghua University,
100084
Beijing, PR
China
3 School of Space Science and Physics,
Shandong University, 264209
Weihai, PR
China
4 Institute of High Energy Physics,
Chinese Academy of Sciences, 100049
Beijing, PR
China
Received: 1 December 2010
Accepted: 23 January 2011
Abstract
We investigate the coherence of the twin kilohertz quasi-periodic oscillations (kHz QPOs) in the low-mass X-ray binary (LMXB) theoretically. The profile of upper kHz QPO, interpreted as Keplerian frequency, is ascribed to the radial extent of the kHz QPO emission region associated with the transitional layer at the magnetosphere-disc boundary, which corresponds to the coherence of upper kHz QPO. The theoretical model for the Q-factor of upper kHz QPO is applied to the observational data of five Atoll and five Z sources, and the consistence is implied.
Key words: accretion: accretion disks / stars: neutron / binaries: close / X-rays: binaries
© ESO, 2011
1. Introduction
The launch of the Rossi X-ray Timing Explorer (RXTE) led to the discovery of kilohertz quasi-periodic oscillations (kHz QPOs) of X-ray spectra in low-mass X-ray binaries (LMXBs), i.e., narrow features in their power density spectra (PDS) (van der Klis 2000, 2006). These frequencies, in the range of 200 ~ 1300 Hz, are the same order as the dynamical timescales of the innermost regions of the accretion flow around the stellar-mass compact objects (van der Klis 2006, 2008), which may carry imprints of strong field general-relativity phenomena (e.g. Kluzniak et al. 1990; Miller et al. 1998; Kluzniak 1998; Abramowicz et al. 2003). Owing to the expected links with the orbital motion, most works about the kHz QPOs focus on the explanation of the emission at these frequencies of the orbital Keplerian motion (e.g. Miller et al. 1998; Stella & Vietri 1998, 1999; Kluzniak & Abramowicz 2001; Abramowicz et al. 2003; Zhang 2004). In addition, the kHz QPOs were found to occur usually in twin peaks (upper ν2 and lower ν1 frequency). They behave in a rather regular way and follow the tight correlations between their frequencies and other observed characteristic frequencies (see, e.g. Psaltis et al. 1998, 1999a; Psaltis et al. 1999b; Stella et al. 1999; Belloni et al. 2002; Titarchuk & Wood 2002; Méndez & van der Klis 1999, 2000; Méndez et al. 2001; Yu et al. 2001; Yu & van der Klis 2002). Moreover, the correlation between the upper frequency and lower frequency across different sources can be roughly fitted by a power-law function (see e.g. Psaltis et al. 1998, 1999a; Zhang et al. 2006a), and also by a linear model (see Belloni et al. 2005, 2007).
The kHz QPOs in LMXB are typical time-variable signals and peaks with some width in PDS, with the particular case of the sharp coherent pulsation 401 Hz and a near 401 Hz X-ray burst oscillation frequency are found in SAX J1808.4-3658 (Chakrabarty et al. 2003; Wijnands et al. 2003; Wijnands 2006), whose profiles can be described by a Lorentzian function (see the lower panel in Fig. 1) ![Mathematical equation: \begin{equation} P_{\nu}\propto A_{0} w/\left[(\nu-\nu_0)^2+(w/2)^2\right], \end{equation}](/articles/aa/full_html/2011/04/aa16248-10/aa16248-10-eq5.png) (1)where ν0 is the peak frequency, w is the full width at half-maximum (FWHM), and A0 is the amplitude of this signal. The ratio of these two quantities is the quality factor, i.e.,
(1)where ν0 is the peak frequency, w is the full width at half-maximum (FWHM), and A0 is the amplitude of this signal. The ratio of these two quantities is the quality factor, i.e.,  (2)This function is characterized by three characteristic quantities used to describe the profile of these signals, i.e., centroid frequency (i.e., peak frequency ν0), quality factor (Q ≡ ν0/FWHM) and the fractional root-mean-squared (rms). The quality factor characterizes the coherence of a QPO signal, while the rms represents a measure of the signal strength, which is proportional to the square root of the peak power contribution to the PDS. The large RXTE archive makes possible searches for systematic correlations between these three characteristic quantities. Using data from RXTE, Barret et al. (2005a) studied 4U 1608-52 and revealed a positive correlation between lower frequency and its quality factor, up to a maximum of about Q ~ 200. Motivated by this idea, Barret et al. (2005b, 2006) studied, in a systematic way, the QPO properties of 4U 1636-536 and the dependency of both quality factor and rms on frequency. It is shown that quality factors for the lower and upper kHz QPOs of 4U 1636-536 follow different tracks in a Q versus frequency plot, i.e. the quality factor for the lower kHz QPO increases with frequency up to 850 Hz (Q ~ 200) and drops precipitously to the highest detected frequencies ~920 Hz (Q ~ 50), while that of the upper kHz QPO increases steadily all the way to the highest detectable QPO frequency. Moreover, the quality factor of the lower QPO is higher than that of the upper QPO (Barret et al. 2005b,c, 2006). In addition, the fractional rms amplitudes of both the upper and lower kHz QPOs increase then decrease steadily towards higher frequencies, with a ceiling in lower kHz QPO (Barret et al. 2005b,c, 2006). A similar behavior was seen for 4U 1608-52 (Barret et al. 2005a). The rough similarity was also extended to 4U 1735-44, 4U 1728-34 (Barret et al. 2006; Boutelier et al. 2009; Méndez 2006; Török 2009). The complete list of references on QPOs from these sources is available in van der Klis (2006). Török (2009) studied the difference in rms amplitude between the upper and lower kHz QPOs as a function of the frequency ratio (ν2/ν1). They found that the rms amplitudes of the twin peaks become equal when the frequencies of the oscillations pass through a certain ratio (ν2/ν1), which is roughly the same for each of the sources. It is also predicted that in a more general context, the behaviour of the amplitude difference suggests a possible energy interchange between the upper and lower QPO modes (Török 2009).
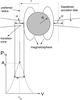 |
Fig. 1 The illustration of Lorentzian function as described in Eq. (1) is associated with the sketch map of the magnetosphere-disc transition layer. The labels A0, ν0, and w are noted in the Lorentzian function Eq. (1). In the upper panel of figure, the stellar radius R, magnetosphere radius, and magnetosphere-disc transition layer width δr are noted, and the kHz QPO profile and its corresponding positions in the transition layer are presented. |
Theoretically, the quality factor and rms amplitude have also been studied but not yet satisfactorily settled. In the past few years, several works, focusing on the quality factor and rms as separated functions of frequencies, have been discussed on these properties, and possible consequences for various QPO models have been outlined (see, e.g., Barret et al. 2005a; Méndez 2006; Barret et al. 2006, for further information and references). Méndez (2006) considered the relation between the innermost stable circular orbit (ISCO) and the sharp decline in both QPO coherence and rms. Barret et al. (2006) discussed the implications of their results and showed how the high-frequency drop-off in quality factor can be accommodated quantitatively in a toy model based on the approach to the ISCO. In their toy model, the change in quality factor was ascribed to three basic parts: (1) the finite extent in radial direction(Δrorb), (2) the radial drift (Δrdrift) during the lifetime of the oscillation, and (3) the finite time itself (Barret et al. 2006). It was also proposed that a drop in the amplitude and quality factor of the QPOs at some limiting frequency is a possible signature of the ISCO (Miller et al. 1998; Barret et al. 2005b,c).
The abrupt rise in X-ray flux, as a cause of QPO, may be related to the abrupt transformation of environment in the accretion process, which is ascribed to the interaction of the magnetosphere-dominated regime and gravitational induced energy-momentum dominated disc. In this respect, the interpretation of the twin kHz QPOs has been ascribed to the orbital Keplerian frequency at the magnetosphere-disc boundary for upper kHz QPO and MHD Alfvèn wave propagation frequency there for lower kHz QPO, respectively (Zhang 2004; Zhang et al. 2007). The quality factor can be attributed to the radial extent of the transition zone where kHz QPOs are produced (see Fig. 1). In this paper, we investigate how this radial extent leads to the profile for upper kHz QPO, which is described in Sect. 2, where the comparison between theory and observations is also presented. Section 3 contains the conclusions and discussions.
2. Formation of the high Q factor and its variation with frequency
According to the MHD Alfvèn wave oscillation model of kHz QPO, the MHD turbulence by the shear flow in the accretion disc (e.g., Ruediger & Pipin 2000) will trigger a strong variation in the plasma energy density and ignite the shear Alfvèn wave motion along the orbit of loop length circumference 2πr at the Keplerian disc orbit radius r (Zhang et al. 2007). In the process of NS accretion, there is a transition from the spherical accretion with high mass density to a polar cap accretion with low mass density (Zhang 2004). It is assumed that this transition occurred at a certain radius called the preferred radius, where a MHD tube loop may be formed to conduct the accreted matter to the polar cap of star. This critical transition may give rise to MHD turbulence and perturb the field lines, thus exciting Alfvèn wave oscillation. In this scenario, the lower and upper frequency correspond to the AWOF with the spherical accretion mass density, which coincides with the Keplerian orbital frequency νk, and the AWOF with the polar accretion mass density, respectively. At the preferred radius r which is defined by the magnetic pressure matching the ram pressure, these two frequencies read (Zhang 2004), respectively, 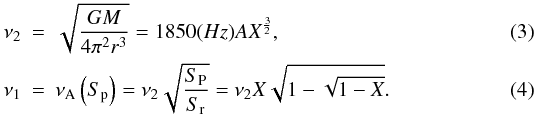 Here, the NS mass M is in units of solar mass, and
  is the AWOF where the area S represents the spherical area Sr = 4πR2 or the polar cap area
 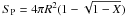 , respectively.
  is the ratio of the star radius R to disc radius r,
  with R6 = R/106(cm), and m is the mass M in the units of solar masses.
We ascribe the upper kHz QPO frequency profile to the X-ray flux strong variations from the transition layer, as shown in the upper panel of Fig. 1. Thus, the range of the upper frequency (δν) should be an indication of the transition layer radial extent (δr or in terms of the scaled quantity X). 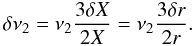 (5)If we define the QPO FWHM w to correspond to the scale of transition layer width, i.e. w ~ δν, then the quality factor for upper frequency (hereafter upper Q-factor) can be written as
  (6)We consider a transition layer (see upper panel of Fig. 1) between the innermost Keplerian orbit and the magnetosphere (Elsner & Lamb 1977; Naso & Miller 2010, 2011), in which the transition of the radial velocity of accretion flow from a Keplerian to a corotation with the NS may occur (Titarchuk et al. 1999, hereafter TLM; Titarchuk & Osherovich 1999). However, in this region the formation of kinks and shocks due to the inhomogeneous density of flow and supersonic motions of accretion flow may be responsible for a super-Keplerian rotation (TLM). After a self-adjustment performed by this layer, the coupling of the sub-Keplerian flow with the super-Keplerian rotation still leads to a Keplerian zone that contributes to the radial drift. When the accreted matter falls into the innermost Keplerian orbit and transition zone, these plasma may strike the magnetospheric boundary and bend the field lines, leading to a change in the magnetospheric shape caused by the strong ram pressure, and can excite the Alfvèn wave oscillation. In the meantime, the plasma is threaded by the field lines and falls onto the polar cap. However, on the magnetospheric boundary, the accreted matter has a range of different velocities and different densities from the former arrivals, which produce some instabilities, such as Kelvin-Helmholtz instability, Rayleigh-Taylor instability, and the inhomogeneities caused by the azimuthal component of the field trapped inside the inner regions of the disc (Romanova et al. 2007). The Kelvin-Helmholtz instability seems to be less significant (Rastätter & Schindler 1999), and we focus only on the Rayleigh-Taylor instability (Kulkarni & Romanova 2008). The unstable disc-magnetosphere boundary results in the penetration of the magnetosphere by the disc matter in kinds of forms. In addition, the disc matter treading the field lines into the magnetosphere from polar cap may move to the equatorial region and swell the magnetosphere. On the basis of this idea and the geometry of the accretion-disc boundary layer (Regev & Hougerat 1988), the radial extent direction can be written as (Elsner & Lamb 1977; Naso & Miller 2010, 2011)
  (7)where the quantity (r − R) represents the scale of the magnetosphere-disc boundary to stellar surface, and α < 1 is a constant ratio coefficient. Therefore, we can obtain
  (8)Using the definition of X and Eq. (3), we can write Q2 with respect to the upper frequency
 ![Mathematical equation: \begin{equation} Q_2 \sim \alpha^{-1}\left[1-\left(\frac{\nu_2}{1850 A}\right)^{\frac{2}{3}}\right]^{-1}. \end{equation}](/articles/aa/full_html/2011/04/aa16248-10/aa16248-10-eq44.png) (9)For the detected twin kHz QPOs, the mass density parameter A is found to be about 0.7 (e.g. Sco X-1) (Zhang 2004; Zhang et al. 2007), except for the two unusual X-ray millisecond pulsar cases SAX J1804.5-3654 and XTE J1807-294, for which A = 0.45 and 0.4, respectively (Zhang et al. 2010). In most cases (except Cir X-1), the position parameter X = R/r lies in the range from 0.7 to 0.92, or the kHz QPO emission position radius is from r = 1.1R to r = 1.4R (Zhang et al. 2010). On average, we have the following expression to evaluate the upper Q-factor,
(9)For the detected twin kHz QPOs, the mass density parameter A is found to be about 0.7 (e.g. Sco X-1) (Zhang 2004; Zhang et al. 2007), except for the two unusual X-ray millisecond pulsar cases SAX J1804.5-3654 and XTE J1807-294, for which A = 0.45 and 0.4, respectively (Zhang et al. 2010). In most cases (except Cir X-1), the position parameter X = R/r lies in the range from 0.7 to 0.92, or the kHz QPO emission position radius is from r = 1.1R to r = 1.4R (Zhang et al. 2010). On average, we have the following expression to evaluate the upper Q-factor, ![Mathematical equation: \begin{equation} Q_2 \sim \alpha^{-1}\left[1-\left(\frac{\nu_2}{1300~ ({\rm Hz})}\right)^{\frac{2}{3}}\right]^{-1}. \label{q2} \end{equation}](/articles/aa/full_html/2011/04/aa16248-10/aa16248-10-eq51.png) (10)To compare the model with the detections of the upper Q-factor, we firstly consider the sources whose spectrum of kHz QPOs displayed the high coherence together in Fig. 2. We choose the parameter α = 0.35,0.55,0.8, respectively, and plot the theoretical curves. We then fit the theoretical expression for Q2 (Eq. (10)) to the observational data and find that the model curve with α = 0.551 fits the data the most accurately, i.e. the radial extent of the preferred radius is about half of the thickness of the magnetosphere-disc boundary to the stellar surface (see Fig. 2). It is can be seen that five Z sources and five Atoll sources (Hasinger 1989, 1990) display different coherence trends, which are described in Fig. 3, with the same meanings as Fig. 2 but with the separate sources for a clearly presentation. The fitting results are listed in Table 1. For the Atoll source 4U 1728-34, there is an abrupt drop at ν ~ 1050 Hz in the Q-ν plot, which we argue to be the effect of the innermost stable orbit (Barret et al. 2005b,c, 2006) causing abrupt kHz QPO profile changes.
(10)To compare the model with the detections of the upper Q-factor, we firstly consider the sources whose spectrum of kHz QPOs displayed the high coherence together in Fig. 2. We choose the parameter α = 0.35,0.55,0.8, respectively, and plot the theoretical curves. We then fit the theoretical expression for Q2 (Eq. (10)) to the observational data and find that the model curve with α = 0.551 fits the data the most accurately, i.e. the radial extent of the preferred radius is about half of the thickness of the magnetosphere-disc boundary to the stellar surface (see Fig. 2). It is can be seen that five Z sources and five Atoll sources (Hasinger 1989, 1990) display different coherence trends, which are described in Fig. 3, with the same meanings as Fig. 2 but with the separate sources for a clearly presentation. The fitting results are listed in Table 1. For the Atoll source 4U 1728-34, there is an abrupt drop at ν ~ 1050 Hz in the Q-ν plot, which we argue to be the effect of the innermost stable orbit (Barret et al. 2005b,c, 2006) causing abrupt kHz QPO profile changes.
 |
Fig. 2 Plot for the upper Q-factor versus its frequency. The data are provided by Barret and Mendez, which have been exploited and discussed in the references (Barret et al. 2005a,b,c, 2006, 2007, 2008; Boutelier et al. 2009, 2010; Mendez 2006). The theoretical curves of upper Q-factor Q2 of Eq. (10) are plotted with the parameter α = 0.35,0.55,0.8 and the average mass density parameter A = 0.7 (Zhang 2004; Zhang et al. 2007). |
 |
Fig. 3 The same meaning with Fig. 2 but for separated sources (five Atoll and five Z sources). The model curves are plotted with the different extent parameter α and average mass density parameter A derived from the detecting data (Zhang et al. 2007). |
3. Conclusions and discussions
We try to ascribe the profile of upper kHz QPO frequency to the radial extent of its emission region in the magnetosphere-disc transition layer, and investigate the evolution of its quality factor as a function of upper frequency. The central frequency of upper kHz QPO originates from a preferred radius r, at which the magnetic pressure matches the ram pressure of the inwardly flowing disc material, and the radial extent of the preferred radius contributes to the frequency extension of the upper kHz QPOs. The narrower this extent, the higher the QPO coherence (or upper Q-factor). After comparing the model with the detected Q-factor data (Fig. 2), we find that the radial extent δr accounts for about half of the transition zone, extending from the stellar surface to the magnetosphere-disc boundary, e.g. (r − R). This means that the X-ray flux from this radial extent contributes primarily to the QPO peak profile (see illustration Fig. 1). For a quantitative discussion of the kHz QPO emission region, we refer to the result of Zhang (2010) that the kHz QPOs of most sources emit from the positions at r ~ 20 km if a stellar radius of R = 15 km is assumed (excluding Cir X-1, its emission position is slightly far from star, e.g. r ~ 30 km), thus the radial extent of the contributions to upper frequency is about 3 km.
The fitting results for the observation data.
When comparing the models of the Q-factors of five Atoll and five Z sources separately, as shown in Fig. 3, we note that there is a large discrepancy in 4U 1728-34 at high frequency, and larger errors in the measurements of Cyg X-2 and GX 340+0. The unusual abrupt drop in the upper Q-factor of 4U 1728-34 is ascribed as the effect of ISCO (Barret et al. 2006). The upper Q-factors of Cyg X-2 and GX 340 + 0, we argue, might not only have a radial extent but also a vertical extent to contribute to the QPO emission regions, and if the thickness extent of the transition layer is considered this might be the source of new ingredients of the QPO profiles. On the thickness of accretion disc and QPO phenomenon, we refer to Chakrabarti et al. (2009). We propose that the complete description of the QPO profile should take both the radial and thickness extents around the preferred radius into account, since the pileup blob of accreting plasma interacts with the magnetosphere to produce the fruitful X-rays in a spatial domain. Moreover, our model on the profile of kHz QPO is concentrated to the upper frequency Q2, which cannot be automatically applied to the lower frequency Q1, and the observations of Q2 and Q1 are apparently different. We ascribe the profile width of ν2 to the radial width of the transition layer of the magnetosphere-disc, which is scaled by δr = r − R, but the profile width of ν1 should not be related to this width. Therefore, there is no relation between Q1 and Q2, although a relation between the upper and lower frequencies can be clearly discerned. In future work, we will attempt to identify the mechanism responsible for the profile of the lower kHz QPO Q1.
Acknowledgments
It is a pleasure to thank S. K. Chakrabarti for discussions, to M. Mendez and D. Barret for providing the QPO data. This work has been supported by the National Natural Science Foundation of China (NSFC 10773017) and the National Basic Research Program of China (2009CB824800).
References
- Abramowicz, M. A., Karas, V., Kluzniak, W., Lee, W. H., & Rebusco, P. 2003, PASJ, 55, 467 [NASA ADS] [CrossRef] [Google Scholar]
- Barret, D., Kluźniak, W., Olive, J. F., Paltani, S., & Skinner, G. K. 2005a, MNRAS, 357, 1288 [NASA ADS] [CrossRef] [Google Scholar]
- Barret, D., Olive, J. F., & Miller, M. C. 2005b, MNRAS, 361, 855 [NASA ADS] [CrossRef] [Google Scholar]
- Barret, D., Olive, J. F., & Miller, M. C. 2005c, Astron. Nachr., 326, 808 [NASA ADS] [CrossRef] [Google Scholar]
- Barret, D., Olive, J. F., & Miller, M. C. 2006, MNRAS, 370, 1140 [NASA ADS] [CrossRef] [Google Scholar]
- Barret, D., Olive, J. F., & Miller, M. C. 2007, MNRAS , 376, 1139 [Google Scholar]
- Barret, D., Boutelier, M., & Miller, M. C. 2008, MNRAS , 384, 1519 [NASA ADS] [CrossRef] [Google Scholar]
- Belloni, T., Psaltis, D., & van der Klis, M. 2002, ApJ, 572, 392 [NASA ADS] [CrossRef] [Google Scholar]
- Belloni, T., Mendez, M., & Homan, J. 2005, A&A, 437, 209 [NASA ADS] [CrossRef] [EDP Sciences] [Google Scholar]
- Belloni, T., Méndez, M., & Homan, J. 2007, MNRAS , 376, 1133 [NASA ADS] [CrossRef] [Google Scholar]
- Boutelier, M., Barret, D., & Miller, M. C. 2009, MNRAS , 399, 1901 [NASA ADS] [CrossRef] [Google Scholar]
- Boutelier, M., Barret, D., Lin, Y., & Török, G. 2010, MNRAS , 401, 1290 [NASA ADS] [CrossRef] [Google Scholar]
- Chakrabarty, D., Morgan, E. H., Muno, M. P., et al. 2003, Nature, 424, 42 [NASA ADS] [CrossRef] [PubMed] [Google Scholar]
- Chakrabarti, S. K., Debnath, D., Pal, P. S., et al. 2009, in Proc. of the 11th Marcel Grossmann Meeting on General Relativity , World Scientific 2008, 569, eprint [arXiv:0903.1482] [Google Scholar]
- Elsner, R. F., & Lamb, F. K. 1977, APJ, 215, 897 [Google Scholar]
- Hasinger, G. 1990, RvMA, 3, 60 [NASA ADS] [Google Scholar]
- Hasinger, G., & van der Klis, M. 1989, A&A, 225, 79 [NASA ADS] [Google Scholar]
- Kluzniak, W. 1998, ApJ, 509, 37 [Google Scholar]
- Kluzniak, W., & Abramowicz, M. A. 2001, Acta Physica Polonica B, 32, 3605 [NASA ADS] [Google Scholar]
- Kluzniak, W., Michelson, P., & Wagoner, R. V. 1990, ApJ, 358, 538 [NASA ADS] [CrossRef] [Google Scholar]
- Kulkarni, A. K., & Romanova, M. M. 2008, MNRAS, 386, 673 [NASA ADS] [CrossRef] [Google Scholar]
- Méndez, M. 2006, MNRAS, 371, 1925 [NASA ADS] [CrossRef] [Google Scholar]
- Méndez, M., & van der Klis, M. 1999, ApJ, 517, L51 [NASA ADS] [CrossRef] [Google Scholar]
- Méndez, M., & van der Klis, M. 2000, MNRAS, 318, 938 [NASA ADS] [CrossRef] [Google Scholar]
- Méndez, M., van der Klis, M., & Ford, E. C. 2001, ApJ , 561, 1016 [NASA ADS] [CrossRef] [Google Scholar]
- Miller, M. C., Lamb, F. K., & Psaltis, D. 1998, ApJ, 508, 791 [NASA ADS] [CrossRef] [Google Scholar]
- Naso, L., & Miller, J. C. 2010, A&A, 521, A31 [NASA ADS] [CrossRef] [EDP Sciences] [Google Scholar]
- Naso, L., & Miller, J. C. 2011, A&A [arXiv:1012.3194] [Google Scholar]
- Psaltis, D., Mendez, M., Wijnands, R., et al. 1998, ApJ, 501, L95 [NASA ADS] [CrossRef] [Google Scholar]
- Psaltis, D., Wijnands, R., Homan, J., et al. 1999a, ApJ, 520, 763 [NASA ADS] [CrossRef] [Google Scholar]
- Psaltis, D., Belloni, T., & van der Klis, M. 1999b, ApJ, 520, 262 [NASA ADS] [CrossRef] [Google Scholar]
- Rastätter, L., & Schindler, K. 1999, APJ, 524, 361 [Google Scholar]
- Regev, O., & Hougerat, A. A. 1988, MNRAS, 232, 81 [NASA ADS] [CrossRef] [Google Scholar]
- Romanova, M. M., Kulkarni, A. K., & Lovelace, R. V. E. 2007 [arXiv:astroph/0711.0418] [Google Scholar]
- Ruediger, G., & Pipin, V. V. 2000, A&A, 362, 756 [NASA ADS] [Google Scholar]
- Stella, L., & Vietri, M. 1998, ApJ, 492, L59 [NASA ADS] [CrossRef] [Google Scholar]
- Stella, L., & Vietri, M. 1999, PRL, 82, 17 [Google Scholar]
- Stella, L., Vietri, M., & Morsink, S. M. 1999, ApJ, 524, L63 [NASA ADS] [CrossRef] [Google Scholar]
- Titarchuk, L., & Osherovich, V. 1999, APJ, 518, L95 [Google Scholar]
- Titarchuk, L., & Wood, K. 2002, ApJ, 577, L23 [NASA ADS] [CrossRef] [Google Scholar]
- Titarchuk, L., Lapidus, I., & Muslimov, A. 1999, APJ, 499, 315 [Google Scholar]
- Török, G. 2009, A&A, 497, 661 [NASA ADS] [CrossRef] [EDP Sciences] [Google Scholar]
- van der Klis, M. 2000, ARA&A, 38, 717 [NASA ADS] [CrossRef] [Google Scholar]
- van der Klis, M. 2006, in Compact stellar X-ray sources, Cambridge Astrophys. Ser. 39, ed. W. H. G. Lewin, & M. van der Klis (Cambridge University Press) [Google Scholar]
- van der Klis, M. 2008, AIPC, 1068, 163 [NASA ADS] [Google Scholar]
- Wijnands, R. 2006, in Trends in Pulsar Research, ed. J. A. Lowry (Nova Science Publishers), 53 [Google Scholar]
- Wijnands, R., van der Klis, M., Homan, J., et al. 2003, Nature, 424, 44 [NASA ADS] [CrossRef] [PubMed] [Google Scholar]
- Yu, W. F., & van der Klis, M. 2002, ApJ, 567, 67 [Google Scholar]
- Yu, W. F., van der Klis, M., & Jonker, P. G. 2001, ApJ, 559, 29 [Google Scholar]
- Zhang, C. M. 2004, A&A, 423, 401 [NASA ADS] [CrossRef] [EDP Sciences] [Google Scholar]
- Zhang, C. M. 2008, AIPC, 1068, 174 [NASA ADS] [Google Scholar]
- Zhang, C. M., Yin, H. X., Zhao, Y. H., Chang, H. K., & Song, L. M. 2007, Astron. Nachr., 328, 475 [NASA ADS] [CrossRef] [Google Scholar]
- Zhang, C. M., Yin, H. X., Zhao, Y. H., Zhang, F., & Song, L. M. 2006a, MNRAS, 366, 1373 [NASA ADS] [CrossRef] [Google Scholar]
- Zhang, C. M., Wei, Y. C., Yin, H. X., et al. 2010, Sci. China, 53, 114 [Google Scholar]
- Zhang, F., Qu, J. L., Zhang, C. M., et al. 2006b, ApJ, 646, 1116 [NASA ADS] [CrossRef] [Google Scholar]
All Tables
All Figures
|
Fig. 1 The illustration of Lorentzian function as described in Eq. (1) is associated with the sketch map of the magnetosphere-disc transition layer. The labels A0, ν0, and w are noted in the Lorentzian function Eq. (1). In the upper panel of figure, the stellar radius R, magnetosphere radius, and magnetosphere-disc transition layer width δr are noted, and the kHz QPO profile and its corresponding positions in the transition layer are presented. |
| In the text | |
|
Fig. 2 Plot for the upper Q-factor versus its frequency. The data are provided by Barret and Mendez, which have been exploited and discussed in the references (Barret et al. 2005a,b,c, 2006, 2007, 2008; Boutelier et al. 2009, 2010; Mendez 2006). The theoretical curves of upper Q-factor Q2 of Eq. (10) are plotted with the parameter α = 0.35,0.55,0.8 and the average mass density parameter A = 0.7 (Zhang 2004; Zhang et al. 2007). |
| In the text | |
|
Fig. 3 The same meaning with Fig. 2 but for separated sources (five Atoll and five Z sources). The model curves are plotted with the different extent parameter α and average mass density parameter A derived from the detecting data (Zhang et al. 2007). |
| In the text | |
Current usage metrics show cumulative count of Article Views (full-text article views including HTML views, PDF and ePub downloads, according to the available data) and Abstracts Views on Vision4Press platform.
Data correspond to usage on the plateform after 2015. The current usage metrics is available 48-96 hours after online publication and is updated daily on week days.
Initial download of the metrics may take a while.