Free Access
Fig. 6
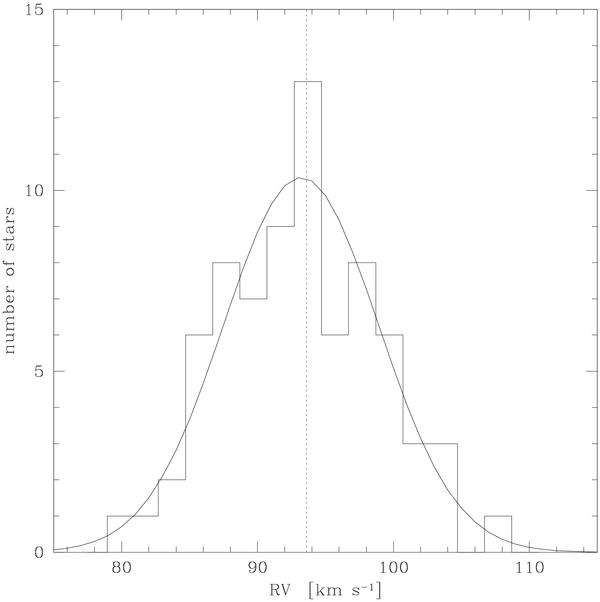
Distribution of the absolute RVs of the observed stars. The curve shows a Gaussian centered on the mean value (93.2 km s-1) and σ equal to the observed dispersion (5.7 km s-1). The dotted line indicates the cluster RV from Harris (1996).
Current usage metrics show cumulative count of Article Views (full-text article views including HTML views, PDF and ePub downloads, according to the available data) and Abstracts Views on Vision4Press platform.
Data correspond to usage on the plateform after 2015. The current usage metrics is available 48-96 hours after online publication and is updated daily on week days.
Initial download of the metrics may take a while.