| Issue |
A&A
Volume 528, April 2011
|
|
|---|---|---|
| Article Number | L15 | |
| Number of page(s) | 5 | |
| Section | Letters | |
| DOI | https://doi.org/10.1051/0004-6361/201016224 | |
| Published online | 03 March 2011 | |
Letters to the Editor
High angular resolution detection of β Pictoris b at 2.18 μm⋆
1
UJF-Grenoble 1 / CNRS-INSU, Institut de Planétologie et d’Astrophysique de
Grenoble (IPAG) UMR 5274,
Grenoble
38041,
France
2
Max Planck Institute for Astronomy, Königstuhl 17, 69117
Heidelberg,
Germany
e-mail: This email address is being protected from spambots. You need JavaScript enabled to view it.
3
LESIA, Observatoire de Paris, 5 place Jules Janssen, 92195
Meudon,
France
4
Space Telescope Science Institute, 3700
San Martin Drive Baltimore,
MD
21218,
USA
5
Centre de Recherche Astronomique de Lyon, 46 allée d’Italie,
69364
Lyon Cedex 7,
France
6
European Southern Observatory, Casilla 19001, Santiago 19, Chile
7
European Southern Observatory, Karl Schwarzschild St 2, 85748
Garching,
Germany
Received:
29
November
2010
Accepted:
25
January
2011
Abstract
Context. A giant planet was recently discovered around the young star β Pictoris. This planet is the closest to its parent star ever imaged. With an estimated mass of about 9 MJup and separation of 8–15 AU, it explains most of the peculiarities of β Pictoris and its disk.
Aims. Previous detections were made in the L′ band (3.8 μm) and at 4.05 μm. We recorded new Ks-band data (2.18 μm) in order to measure its color and get an additional estimate of its mass and effective temperature
Methods. Angular differential Ks-band images of β Pictoris were recorded with NaCo in March and April 2010.
Results. The companion is detected at Ks. This independently confirms the physical nature of β Pictoris b inferred from the L′ and NB_4.05 bands. The increase of the projected separation between October–December 2009 and April 2010 observations is consistent within error bars with the expected orbital motion. Using the absolute Ks photometry, “hot start” evolutionary models predict a mass of 7–11 MJup in agreement with previous estimates. Moreover, this mass is compatible with Teff = 1700 ± 300 K derived from the comparison of the Ks − L′ color with those generated using synthetic spectra.
Key words: instrumentation: adaptive optics / stars: early-type / planetary systems / stars: individual β Pictoris
Based on observations collected at the European Southern Observatory, Chile, ESO. Program ID: 284.C-5057.
© ESO, 2011
1. Introduction
Since the discovery of circumstellar debris disks in the eighties, the young ( Myr; Zuckerman et al. 2001) and close (19.44 ± 0.05 pc; van Leeuwen 2007) A5V star β Pictoris has been considered as a prototype of young planetary systems. Together with the other imaged debris disks, this system enables the study of the physical and chemical characteristics of sites where planetary formation is ongoing or just finished. Recently, we were able to detect a companion that orbits the star at a distance ranging between 8 and 15 AU. Its L′ = 11.20 ± 0.151 apparent magnitude translates into a temperature of ~1500 K and a mass of ~8 MJup according to Lyon’s group models (Baraffe et al. 2003). As such, and if located at 8–15 AU, the companion could explain most morphological (asymmetries) and dynamical peculiarities of the β Pictoris dust system, as well as the falling evaporating bodies phenomenon at the origin of the replenishment of the disk gas phase. In particular, it could explain the characteristics of the warp observed within the inner part of the disk (Lagrange et al. 2010, and references therein; hereafter L10). Interestingly in the present context of planet formation theories, β Pictoris b is located in the disk region where giant planets can form by core-accretion, in contrast to the few other planets detected by direct imaging so far (Marois et al. 2008; Kalas et al. 2008; Chauvin et al. 2005a,b; Lafrenière et al. 2010), which are located farther away from their parents.
Observing log of the β Pictoris data, and corresponding atmospheric conditions.
The mass determination of β Pictoris b and those of the other imaged planets relie however on the model-dependent luminosity-mass relation provided by the so-called evolutionary models. The “hot-start” evolutionary models consider the formation of planets by a spherical collapse of a gaseous cloud, where all the released gravitational energy is transfered into heat. The young planet is therefore hot during its first 100 Myr, which may allow the direct detection of the planet around young stars with current instruments. Recently, however, Fortney et al. (2008) have developed an alternative “cold-start” model, in which a significant amount of energy is lost during the gas accretion process. This model accounts for the stages of core accretion. As a result of this loss of energy, Fortney et al. (2008) predict planets much fainter than the “hot-start” model predictions at young ages: a 10 MJup planet for instance is predicted to be 7 mag fainter in the K band at 10 Myr. Under these assumptions, and except during the very short accretion stage, young planets would not be detectable with current instruments. We note that the difference between both models decreases with time, but remains significant up to 1 Gyr for very massive planets. Because these different models, which probably represent two extreme situations, have not been calibrated so far, their reliability is still questionable. This is why detecting and characterizing the properties of young giant planets, and ultimately measuring their masses, is fundamental to validate the models.
In order to further constrain the β Pictoris b properties (magnitude, colors), we performed high-contrast and high-spatial resolution observations with NaCo (Rousset et al. 2003; Lenzen et al. 2003) at Ks in early 2010. We present these observations in Sect. 2 and discuss them in Sect. 3.
2. Observations and data reduction procedures
2.1. Observations
Ks-band images of β Pictoris were obtained in March and April 2010 with the VLT/NaCo instrument in service mode operated in angular differential imaging (hereafter ADI, Marois et al. 2006). The visible wavefront sensor was used with the 14 × 14 lenslet array, together with a visible dichroic that transmits the visible light to the wave front sensor and the IR light to CONICA. We chose the CONICA S13 camera in March and the S27 camera in April. They provide pixel scales of 13.27 and 27.15 mas, respectively. Saturated images of β Pictoris were recorded, along with a few non saturated images to estimate the stellar point-spread-function (PSF) and serve as a photometric calibrator. In March we adopted a two-position dithering pattern every three DIT × NDIT exposures with DIT = 0.35 s, and NDIT = 100. In April we chose a four-position dithering pattern every two DIT × NDIT exposures with DIT = 0.15 s and NDIT=150. The DIT were chosen so as to saturate the PSF core of β Pictoris over ~8 pixels. Each frame was stored in a datacube. Both settings allow accurate sky and instrumental background removal. For the PSF images, a neutral density filter (transmission = 1.12%, Boccaletti et al. 2008) was inserted in the CONICA optical path. Finally, twilight flat-fields were recorded as well.
The log of the observations is reported in Table 1, along with the observing conditions. We note that as the star was fairly low on the horizon, the variations of the parallactic angle and hence the field-of-view (FoV) rotation during the saturated sequences were relatively small (2.2 × FWHM at a separation of 350 mas for the March and April observations) at the separation of the companion. This value is nevertheless high enough to perform ADI reduction (see below).
2.2. Data reduction
The reduction procedure basically follows that described in the supporting online material2 of Lagrange et al. (2010). The scheme consists of 1) correcting each image in each datacube for background and sky variations as well as bad/hot pixels; 2) rejecting the frames with low-Strehl ratio3; 3) collapsing the cubes4; 4) recentering the “cleaned” images thus obtained; 5) estimating the stellar halo for each image; 6) subtracting the estimated stellar halo from each image; 7) derotating the residual images thus obtained; and 8) stacking (average or median) the derotated residual images. The most critical steps are the centering of the data, which limits the final astrometric precision of the companion position, and the estimate of the stellar halo, which affects the levels of residuals. The centering is done either with a cross-correlation of the different images, or fitting a Moffat function.
The estimate of the star halo is made using two different ADI algorithms:
-
For each image i, we select first the images of the data set for which the FoV has rotated by more than α × FWHM at the approximate separation of β Pictoris b, ie 26 pixels (S13 data) or 13 pixels (S27 data). Among these selected images, we keep the nclosest in time. These n images are then averaged and subtracted to image i. The individual residuals thus obtained are derotated. Their mean or median is then computed to obtain the final image. Different values of αand nwere tried. The optimal results are obtained for n = 6 and α = 1.2 (S13) and 1.0 (S27). We note that the best values of αare a compromise between having a large field rotation and a large number of usable files. This method is referred to as Red1.
-
We developed an algorithm following the Lafrenière et al. (2007) LOCI approach. The halo is estimated and subtracted for a given input frame i inside N boxes (radially and azimuthally defined), taking a linear combination of the input frames. The coefficients of the combination are determined so as to minimize the residual variations inside an optimization zone taken on the halo-subtracted image i. Optimization regions are much bigger (typically 300 FWHM in area) than subtracted zones to avoid self-eliminating point-like objects. The LOCI provides the best extraction of the planetary signal for α = 0.5 and using 40 to 80 frames out of 120. This method is referred to as Red2.
2.3. Photometric measurements
Some of the planet flux was self-substracted during the stellar halo removal process. To retrieve the photometric information inside our final images, we followed two approaches:
-
We inject five artificial planets (AP) into the raw images at aseparation similar to that ofβ Pictoris b, but with differentprojection angles (referred to as sym. AP). The AP is built usingthe unsaturated reduced image ofβ Pictoris scaled to a given planetmagnitude. We then search for the averaged flux that minimizesthe difference between β Pictoris band the fake planets. The standard deviation of flux ratio valuesderived from the set of fake planets gives an estimate of the error onthe planet flux.
-
We inject AP with a given flux at the position of the detected source, and subtract it to this source into the raw images (referred as neg.AP). We iterate with different AP fluxes and injection positions to minimize the standard deviation of the residuals inside a radially and azimuthally limited aperture centered at the position of the companion. The moderate dispersion of optimals injected AP flux found using different apertures sizes (240mas ≲ Rin ≲ 300mas, 400mas ≲ Rout ≲ 500mas, 10° ≤ Δθ ≤ 90° with Rin and Rout the inner and outer radii, and Δθ the azimuthal extension on each side of the companion) for the estimate of the residuals provides an estimate of the photometric error.
The photometry is measured on the data reduced with Red1 only, because this method limits nonlinear flux losses.
2.4. Astrometric measurements
To derive the separation and position angle of the companion with respect to the star, we need to locate the accurate position of the planet and that of the star on the detector pixels. For the companion we considered two methods:
-
LOCI images provide the best speckle rejection and are thereforemore appropriate to accurately locate the position of the planetwith a straightforward algorithm (in most cases the planet isbrighter than the speckles). Gaussian fitting is applied on arepresentative set of LOCI images (various parameters are used)in the S13 and S27 data. We then obtained themeans and standard deviations.
-
We cross-correlated and subtracted an AP pattern injected at and slightly around the estimated position of the companion (changing the injection position by up to 0.5 pixel with 0.1 pixel increments) inside the Red1 images. This method is applied while estimating the photometry with neg.AP. The error on the position is derived considering the extrema of the different optimal injection coordinates, for which the injection flux lies between ± ε of the optimal injection flux. ε is the minimum standard deviation found for the optimal injection flux. It also takes into account the influence of the size of the optimization zone.
The star location is measured on the median of the saturated images by fitting a Moffat function. But the saturation causes the centroid estimate to be impacted by some very close speckles. We then built a fake saturated PSF using the non-saturated frames to quantify this effect and account for it in our error bars (between 0.1 and 0.4 pixel). The final projection angles (PA) and separations (ρ) are reported in Table 2. As expected, the imperfect determination of the centroid of the star caused by the saturation is the largest source of uncertainty in the astrometric position of the planet. the residuals.
Photometric and astrometric measurements in the Ks band.
3. Results and discussion
3.1. β Pictoris b at Ks
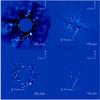 |
Fig. 1 β Pictoris b at Ks. Top: Ks, S13 data, with a 13 mas/pixel sampling (left) and Ks, S27 data, with a 27 mas/pixel sampling (right). These images were obtained with method Red1. Bottom: Ks, S13(left) and Ks, S27 data (right) reduced with method Red2 (LOCI). |
Figure 1 shows the images obtained during both runs. They do confirm the planet detection. Together with the detection at M band with the recently available apodizing phase plate (APP) device on NaCo (Quanz et al. 2010, hereafter Q10), we now have two confirmations of the β Pictoris b recovery.
We find separations (331–358 mas) and PA (205.8–211.2°) in agreement with the Q10 values. The planet separation has then increased between October–December 2009 and April 2010. The variation agrees with an edge-on orbital motion in the sense of rotation of the β Pictoris disk. (27 mas between October–December 2009 and April 2010 for an orbit with a semi-major axis a = 8 UA, an excentricity e = 0.05, and a periastron longitude ω = −55°). Further measurements will be necessary to secure and monitor this small orbital variation.
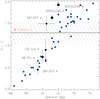 |
Fig. 2 K − L′ color of β Pictoris b (dashed zone; transfered from the NACO to the MKO system) compared with those of field dwarfs (blue spots) and young substellar objects (black dots). The color is compatible with those of field L1–T0 dwarfs. |
The photometric measurements are also reported in Table 2. Both photometric methods lead to similar contrast values that do not depend on the camera. The uncertainties are reduced however when using neg.AP. We finally adopt ΔKs = 9.2 ± 0.1 mag. We retrieved the NaCo Ks-band magnitude of the star (Ks[NaCo] = 3.444 ± 0.009 mag) from the ESO K-band magnitude of van der Bliek et al. (1996). We first derived the 2MASS magnitude of the star5 from updated transformation formulas6 of Carpenter (2001). We found an additional 0.007 mag shift between the NaCo and the 2MASS systems using the spectrum of an A5 star of the Pickles (1998) library. We then derived Ks = 12.64 ± 0.11 mag and MKs = 11.20 ± 0.12 mag for the companion. We finally found Ks − L′ = 1.43 ± 0.19 mag for β Pictoris b, assuming quadratically combined errors.
3.2. Spectral type, atmospheric parameters, and mass
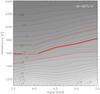 |
Fig. 3 Isocontour plot of Ks − L′ variations (NaCo photometric system) with Teff and log g computed on BT-SETTL10 spectra. The overlaid β Pictoris b color (red line) with its uncertaities (red dotted line) constrains the Teff to 1700 ± 300 K. |
We compared the Ks − L′ color of β Pictoris b to the color of field dwarfs from Golimowski et al. (2004) in Fig. 2. This required translating the color into the MKO system (Simons & Tokunaga 2002; Tokunaga et al. 2002). Because there currently is no spectral library of late-type dwarfs that covers the full NaCo L′ band yet (3.38–4.31 μm), we found a color correction between the NaCo and MKO filters system of 0.135–0.184 mag using synthetic spectra of the state-of-the-art BT-SETTL10 library7 (Allard et al. 2010) with Teff = 1400–1800 K and log g = 3.5–5.0 dex. The same operation was repeated for the components of the young 2M1207 system (~8 Myr, Chauvin et al. 2004; Patience et al. 2010) and for AB Pic b (~30 Myr, Chauvin et al. 2005b, Bonnefoy et al. in prep.) assuming the Teff and surface gravities (log g) found in the literature. Their colors are reported in Fig. 2, along with those of GQ Lup b (~1 Myrs, Marois et al. 2007; Lavigne et al. 2009) and SDSS J224953.47+004404.6AB (~100 Myr, Allers et al. 2010). The color is compatible with those of L1 to ~ T0 field dwarfs. This result fits well with the conclusions of Q10 from the L′ – NB_4.05 color. However, we notice that the colors of 2M1207 B and SDSS J224953.47+004404.6AB are ~0.5 mag redder than those of L field dwarf analogs. Allers et al. (2010) suggest that this apparent redenning could be a signature of youth. Hence, this could eventually shift the β Pictoris b spectral type range toward earlier classes.
The color can also be compared with those of BT-SETTL10 spectra for various effective Teff and log g (Fig. 3). The colors were synthetized using the NaCo passbands and a spectrum of Vega. We deduced Teff = 1700 ± 300 K for β Pictoris b, but were unable to constrain log g. Our results are compatible with those obtained with the former libraries AMES-DUSTY00 and AMES-COND00 (Allard et al. 2001) and with the Teff ~ 1470–1700 K derived by Q10.
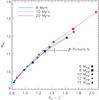 |
Fig. 4 Location of β Pictoris b in a color-magnitude diagram with respect to the SETTL evolutionary tracks. The colors and magnitudes are given in the NaCo photometric system. |
We infer a mass between 7 and 11 MJup from the comparison of MKs to the SETTL evolutionary models8 (using the interior models of Chabrier et al. 2000, and the BT-SETTL atmospheric models). This excellently agrees with the mass derived from the L′ band, the NB_4.05 band and our Teff estimate. Also, β Pictoris b falls on the SETTL evolutionary tracks inside a MKs versus Ks – L′ diagram (Fig. 4). Finally, we note that if β Pic b indeed formed by “core-accretion”, then the masses predicted by the “cold-start” model using the availiable photometric measurements and the current Teff estimate are well above the upper limit set by the dynamical study of the disk and past radial velocity measurements on the star. All these results further reinforce the idea that this companion lies inside the planetary mass range.
Forthcoming J and H imaging and L′ band spectroscopy of β Pictoris b (with the APP+spectro mode on NaCo for example) should bring additional constraints on Teff. The planet-finder instruments Gemini/GPI and VLT/SPHERE will certainly provide the first NIR spectra of the companion. These new observations should enable the first estimates of log g and of the metallicity. Finding abundancies different from the star ([M/H] = 0.05, Gray et al. 2006) could give additional insights on the formation mechanism of this companion (Chabrier et al. 2007; Fortney et al. 2008). These should improve our knowledge of the physics and chemistry involved in exoplanetary atmospheres. To conclude, this system offers the opportunity to measure the dynamical mass of the companion using imaging in combination with radial velocity measurements corrected from β Pictoris activity. Together with the luminosity, the Teff, log g, and M/H, it could provide a key toward understanding the formation and evolution of exoplanets.
Taking the weighted mean and the standard deviation of the different values reported in Lagrange et al. (2009) and Lagrange et al. (2010).
When the Strehl is low, the flux is less concentrated into the saturated area. We then integrated the flux over a circular apperture centered on the star in each cube frames. We computed the mean and the standard deviation (σ) of the values. The frames whose integrated flux was lying κ × σ above the mean were rejected. κ was set to 3.
Given the relatively short exposure times (22.5 to 35 s), and the star position at the observing time, the FoV did not rotate significantly during the recording of each data cube, so that the data within each cube can be safely averaged out into a single frame without this impacting on the image quality.
The measured 2MASS magnitude was not used directly since it has a 0.222 mag uncertainty.
The tracks can be generated at http://phoenix.ens-lyon.fr/simulator/index.faces
Acknowledgments
We are gratefull to our anonymous referee for his very useful review. We would like to thank the ESO staff for his help. We acknowledge financial support from the French Programme National de Planétologie (PNP, INSU).
References
- Allard, F., Hauschildt, P. H., Alexander, D. R., Tamanai, A., & Schweitzer, A. 2001, ApJ, 556, 357 [NASA ADS] [CrossRef] [Google Scholar]
- Allard, F., Homeier, D., & Freytag, B. 2010 [arXiv:1011.5405] [Google Scholar]
- Allers, K. N., Liu, M. C., Dupuy, T. J., & Cushing, M. C. 2010, ApJ, 715, 561 [NASA ADS] [CrossRef] [Google Scholar]
- Baraffe, I., Chabrier, G., Barman, T. S., Allard, F., & Hauschildt, P. H. 2003, A&A, 402, 701 [NASA ADS] [CrossRef] [EDP Sciences] [Google Scholar]
- Boccaletti, A., Chauvin, G., Baudoz, P., & Beuzit, J. 2008, A&A, 482, 939 [NASA ADS] [CrossRef] [EDP Sciences] [Google Scholar]
- Carpenter, J. M. 2001, AJ, 121, 2851 [NASA ADS] [CrossRef] [Google Scholar]
- Chabrier, G., Baraffe, I., Allard, F., & Hauschildt, P. 2000, ApJ, 542, 464 [NASA ADS] [CrossRef] [Google Scholar]
- Chabrier, G., Baraffe, I., Selsis, F., et al. 2007, Protostars and Planets V, 623 [Google Scholar]
- Chauvin, G., Lagrange, A., Dumas, C., et al. 2004, A&A, 425, L29 [NASA ADS] [CrossRef] [EDP Sciences] [MathSciNet] [Google Scholar]
- Chauvin, G., Lagrange, A., Dumas, C., et al. 2005a, A&A, 438, L25 [NASA ADS] [CrossRef] [EDP Sciences] [Google Scholar]
- Chauvin, G., Lagrange, A., Zuckerman, B., et al. 2005b, A&A, 438, L29 [NASA ADS] [CrossRef] [EDP Sciences] [Google Scholar]
- Fortney, J. J., Marley, M. S., Saumon, D., & Lodders, K. 2008, ApJ, 683, 1104 [NASA ADS] [CrossRef] [Google Scholar]
- Golimowski, D. A., Leggett, S. K., Marley, M. S., et al. 2004, AJ, 127, 3516 [NASA ADS] [CrossRef] [Google Scholar]
- Gray, R. O., Corbally, C. J., Garrison, R. F., et al. 2006, AJ, 132, 161 [NASA ADS] [CrossRef] [Google Scholar]
- Kalas, P., Graham, J. R., Chiang, E., et al. 2008, Science, 322, 1345 [NASA ADS] [CrossRef] [PubMed] [Google Scholar]
- Lafrenière, D., Marois, C., Doyon, R., Nadeau, D., & Artigau, É. 2007, ApJ, 660, 770 [NASA ADS] [CrossRef] [Google Scholar]
- Lafrenière, D., Jayawardhana, R., & van Kerkwijk, M. H. 2010, ApJ, 719, 497 [NASA ADS] [CrossRef] [Google Scholar]
- Lagrange, A., Gratadour, D., Chauvin, G., et al. 2009, A&A, 493, L21 [NASA ADS] [CrossRef] [EDP Sciences] [Google Scholar]
- Lagrange, A., Bonnefoy, M., Chauvin, G., et al. 2010, Science, 329, 57 [NASA ADS] [CrossRef] [PubMed] [Google Scholar]
- Lavigne, J., Doyon, R., Lafrenière, D., Marois, C., & Barman, T. 2009, ApJ, 704, 1098 [NASA ADS] [CrossRef] [Google Scholar]
- Lenzen, R., Hartung, M., Brandner, W., et al. 2003, in Society of Photo-Optical Instrumentation Engineers (SPIE), ed. M. Iye & A. F. M. Moorwood, Conf. Ser., 4841, 944 [Google Scholar]
- Marois, C., Lafrenière, D., Doyon, R., Macintosh, B., & Nadeau, D. 2006, ApJ, 641, 556 [Google Scholar]
- Marois, C., Macintosh, B., & Barman, T. 2007, ApJ, 654, L151 [NASA ADS] [CrossRef] [Google Scholar]
- Marois, C., Macintosh, B., Barman, T., et al. 2008, Science, 322, 1348 [NASA ADS] [CrossRef] [PubMed] [Google Scholar]
- Patience, J., King, R. R., de Rosa, R. J., & Marois, C. 2010, A&A, 517, A76 [NASA ADS] [CrossRef] [EDP Sciences] [Google Scholar]
- Pickles, A. J. 1998, PASP, 110, 863 [CrossRef] [Google Scholar]
- Quanz, S. P., Meyer, M. R., Kenworthy, M., et al. 2010, ApJ, 722, L49 (Q10) [NASA ADS] [CrossRef] [Google Scholar]
- Rousset, G., Lacombe, F., Puget, P., et al. 2003, in Society of Photo-Optical Instrumentation Engineers (SPIE) Conference Series, ed. P. L. Wizinowich & D. Bonaccini, 4839, 140 [Google Scholar]
- Simons, D. A., & Tokunaga, A. 2002, PASP, 114, 169 [NASA ADS] [CrossRef] [Google Scholar]
- Tokunaga, A. T., Simons, D. A., & Vacca, W. D. 2002, PASP, 114, 180 [NASA ADS] [CrossRef] [Google Scholar]
- van der Bliek, N. S., Manfroid, J., & Bouchet, P. 1996, VizieR Online Data Catalog, 411, 90547 [Google Scholar]
- van Leeuwen, F. 2007, A&A, 474, 653 [NASA ADS] [CrossRef] [EDP Sciences] [Google Scholar]
- Zuckerman, B., Song, I., Bessell, M. S., & Webb, R. A. 2001, ApJ, 562, L87 [NASA ADS] [CrossRef] [Google Scholar]
All Tables
All Figures
|
Fig. 1 β Pictoris b at Ks. Top: Ks, S13 data, with a 13 mas/pixel sampling (left) and Ks, S27 data, with a 27 mas/pixel sampling (right). These images were obtained with method Red1. Bottom: Ks, S13(left) and Ks, S27 data (right) reduced with method Red2 (LOCI). |
| In the text | |
|
Fig. 2 K − L′ color of β Pictoris b (dashed zone; transfered from the NACO to the MKO system) compared with those of field dwarfs (blue spots) and young substellar objects (black dots). The color is compatible with those of field L1–T0 dwarfs. |
| In the text | |
|
Fig. 3 Isocontour plot of Ks − L′ variations (NaCo photometric system) with Teff and log g computed on BT-SETTL10 spectra. The overlaid β Pictoris b color (red line) with its uncertaities (red dotted line) constrains the Teff to 1700 ± 300 K. |
| In the text | |
|
Fig. 4 Location of β Pictoris b in a color-magnitude diagram with respect to the SETTL evolutionary tracks. The colors and magnitudes are given in the NaCo photometric system. |
| In the text | |
Current usage metrics show cumulative count of Article Views (full-text article views including HTML views, PDF and ePub downloads, according to the available data) and Abstracts Views on Vision4Press platform.
Data correspond to usage on the plateform after 2015. The current usage metrics is available 48-96 hours after online publication and is updated daily on week days.
Initial download of the metrics may take a while.