Free Access
Fig. 5
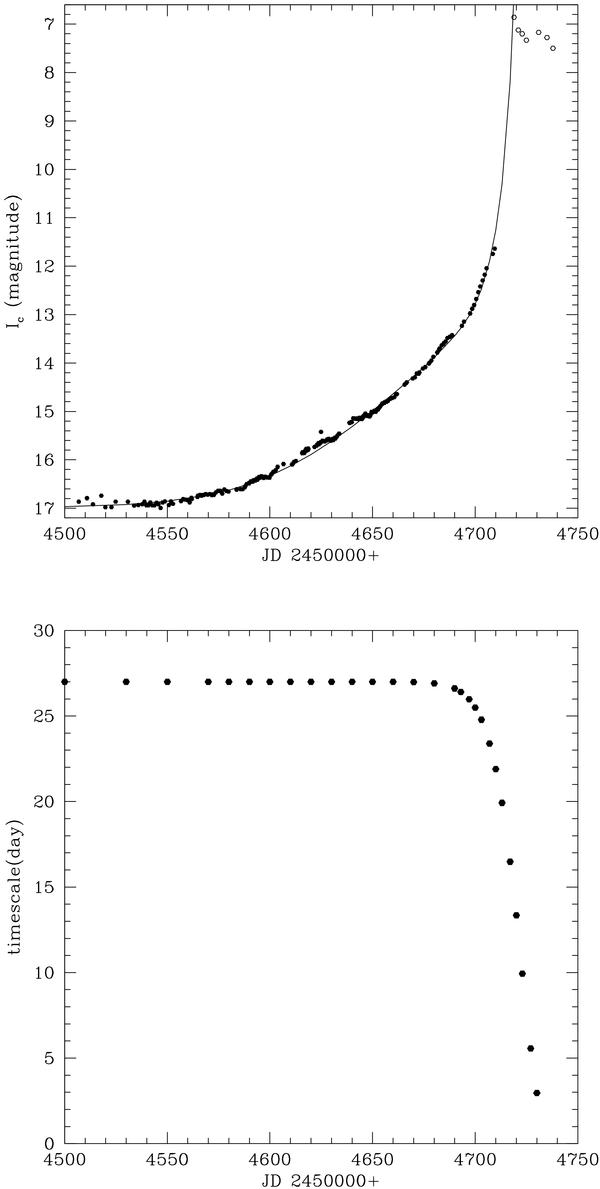
I light curve of V1309 Sco during its rise to maximum in 2008 (upper part). Full points: data from OGLE III, open points: data from AAVSO. The line shows a fit of an exponential formula (Eq. (2)). The time scale used in the formula is plotted in the lower part of the figure.
This figure is made of several images, please see below:
Current usage metrics show cumulative count of Article Views (full-text article views including HTML views, PDF and ePub downloads, according to the available data) and Abstracts Views on Vision4Press platform.
Data correspond to usage on the plateform after 2015. The current usage metrics is available 48-96 hours after online publication and is updated daily on week days.
Initial download of the metrics may take a while.