Free Access
Fig. 3
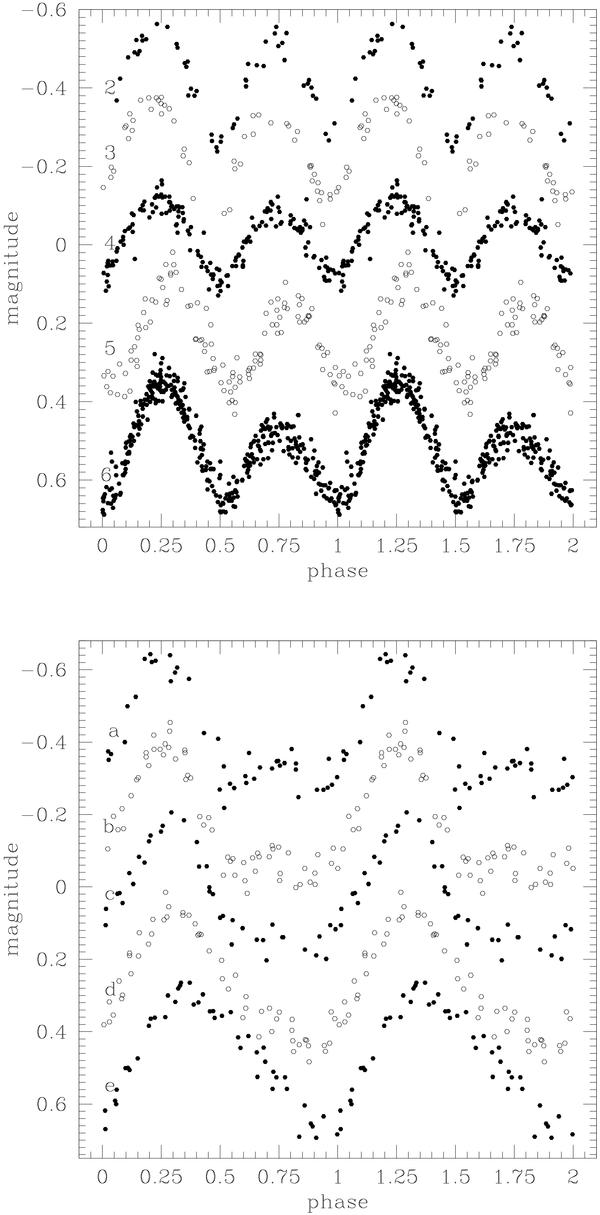
Light curves obtained from folding the data with the period described by Eq. (1). Upper part: seasons 2002−2006. Lower part: season 2007 devided into five subsamples (time goes from a to e). The zero point of the magnitude (ordinate) scale is arbitrary.
This figure is made of several images, please see below:
Current usage metrics show cumulative count of Article Views (full-text article views including HTML views, PDF and ePub downloads, according to the available data) and Abstracts Views on Vision4Press platform.
Data correspond to usage on the plateform after 2015. The current usage metrics is available 48-96 hours after online publication and is updated daily on week days.
Initial download of the metrics may take a while.