Fig. 8
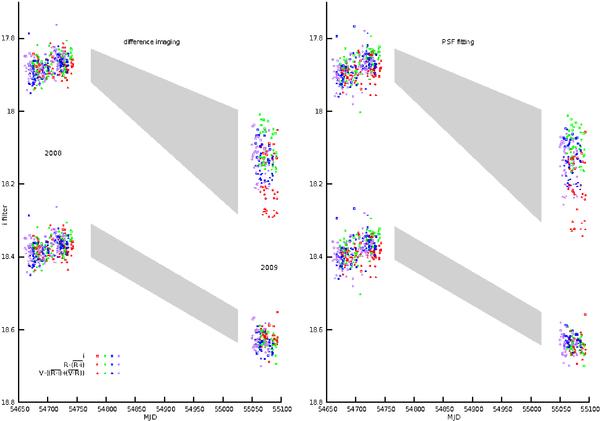
Upper light curve: “global i” light curve of the four lensed components of HE0435-1223 obtained after subtracting the average 2008 i difference in magnitude from “B”, “C”, and “D” with respect to component “A”; then corrected for the time delays provided by Kochanek et al. (2006) and finally subtracting from the R and the V light curves the average 2008 R − i and (R − i) + (V − R) color indices, respectively. Lower light curve: “global i” light curve obtained repeating the same procedure as for the upper one, but correcting for the average 2008 magnitude and color indices concerning the 2008 data, and for the 2009 average magnitude and color indices concerning the 2009 data. The left panel shows the results obtained with the difference imaging technique, while the right panel shows the results obtained with the PSF fitting technique. The gray quadrilaterals help to connect the two epochs of observation. The lower light curves are arbitrarily shifted in magnitude.
Current usage metrics show cumulative count of Article Views (full-text article views including HTML views, PDF and ePub downloads, according to the available data) and Abstracts Views on Vision4Press platform.
Data correspond to usage on the plateform after 2015. The current usage metrics is available 48-96 hours after online publication and is updated daily on week days.
Initial download of the metrics may take a while.