Free Access
Fig. 5
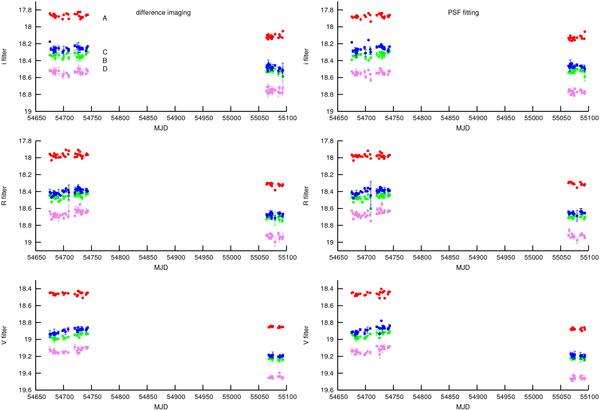
Light curves of the four lensed components of HE0435-1223. The different graphs illustrate the photometry in the i, R and V bands, calculated using the difference imaging technique (left) and the PSF fitting technique (right). The error bars correspond to the magnitude rms (1σ) of each night of observation.
Current usage metrics show cumulative count of Article Views (full-text article views including HTML views, PDF and ePub downloads, according to the available data) and Abstracts Views on Vision4Press platform.
Data correspond to usage on the plateform after 2015. The current usage metrics is available 48-96 hours after online publication and is updated daily on week days.
Initial download of the metrics may take a while.