Free Access
Fig. 4
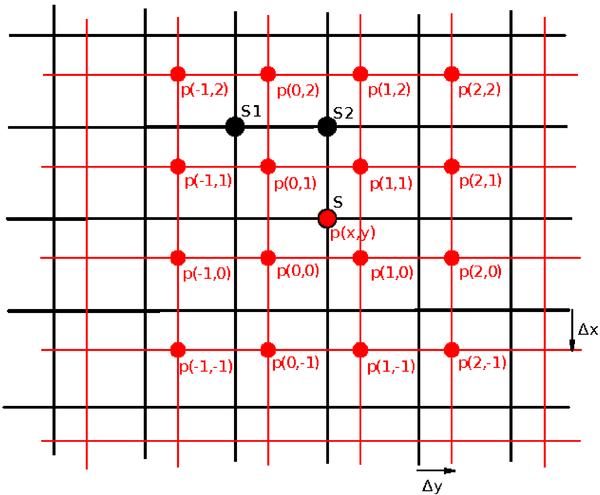
Scheme for the superposed images of the first (little dots, lighter grid) and second (big dots, bolder grid) stars. The big dots correspond to the knots with known fluxes. The arrows Δx and Δy indicate the shift between the two images.
Current usage metrics show cumulative count of Article Views (full-text article views including HTML views, PDF and ePub downloads, according to the available data) and Abstracts Views on Vision4Press platform.
Data correspond to usage on the plateform after 2015. The current usage metrics is available 48-96 hours after online publication and is updated daily on week days.
Initial download of the metrics may take a while.