Fig. 8
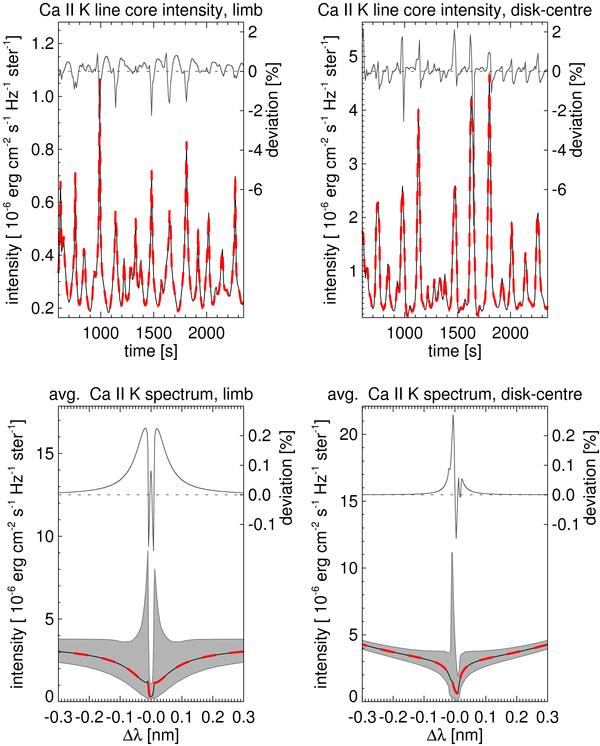
Emergent intensity in the Ca ii K line: temporal evolution of the line core intensity (top row) and time-averaged spectrum (bottom row) at the solar limb (μ = 0.05, left column) and at disk-centre (μ = 1.0, right column). Each panel contains the results from the non-equilibrium simulation (IK,TD, solid) and from the statistical equilibrium solution (IK,SE, red thick dashed) together with the corresponding difference (IK,TD − IK,SE) / IK,SE) between both (solid grey line at the top of each panel). The grey areas in the bottom panels represent the full data ranges of all intensity profiles during the simulation sequence between t = 600 s and t = 2350 s.
Current usage metrics show cumulative count of Article Views (full-text article views including HTML views, PDF and ePub downloads, according to the available data) and Abstracts Views on Vision4Press platform.
Data correspond to usage on the plateform after 2015. The current usage metrics is available 48-96 hours after online publication and is updated daily on week days.
Initial download of the metrics may take a while.