Fig. 7
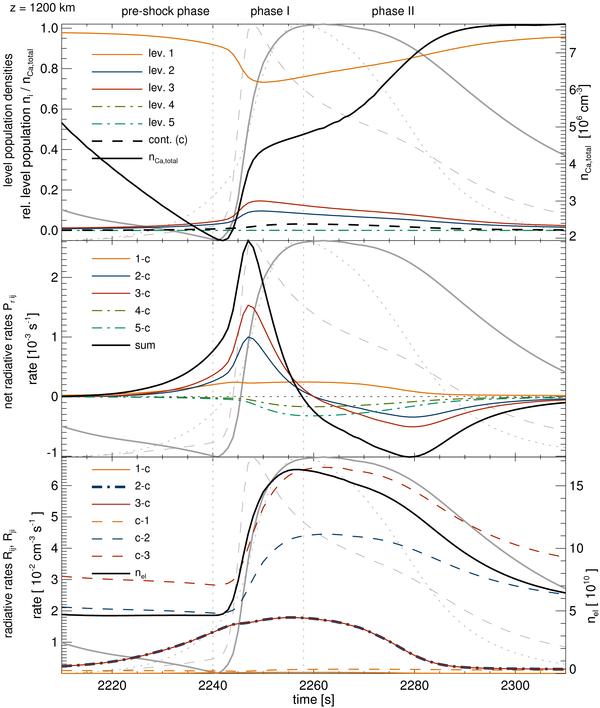
Temporal evolution at a fixed geometric height of z = 1200 km. Top: total Ca number density nCa,total and relative level populations ni / ntotal. Middle: net radiative transition rates Pr ij for the b-f transitions between the bound levels and the continuum together with the overall sum  . Bottom: the involved radiative rates Rij and Rji in comparison to the density of free electrons nel. The Ca ii-iii ionisation fraction χCa (grey dotted line), the gas temperature (grey dashed line), and the inversed relaxation timescale (grey solid line) are shown in all panels as reference. The rates for the transitions from the bound levels 1 − 5 to the continuum (i = 6) are divided by the total Ca number densities. Positive rates indicate ionisation, negative rates recombination.
Current usage metrics show cumulative count of Article Views (full-text article views including HTML views, PDF and ePub downloads, according to the available data) and Abstracts Views on Vision4Press platform.
Data correspond to usage on the plateform after 2015. The current usage metrics is available 48-96 hours after online publication and is updated daily on week days.
Initial download of the metrics may take a while.