Fig. 5
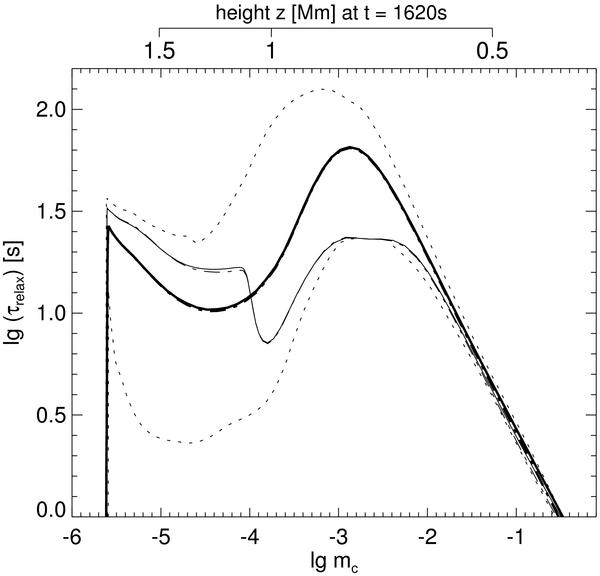
Numerical relaxation timescale as function of column mass determined numerically (solid line) compared to the timescale determined from eigenvalues of the rate matrix in the initial statistical equilibrium states (dot-dashed). The thick lines represent the averages over all time steps between t = 600 s and t = 2350 s, whereas the thin lines are for a particular time step at t = 1620 s. Minimum and maximum values for both dynamic and eigenvalue timescales during the considered time window are shown as grey dotted lines. For reference, the height scale at t = 1620 s is given on top.
Current usage metrics show cumulative count of Article Views (full-text article views including HTML views, PDF and ePub downloads, according to the available data) and Abstracts Views on Vision4Press platform.
Data correspond to usage on the plateform after 2015. The current usage metrics is available 48-96 hours after online publication and is updated daily on week days.
Initial download of the metrics may take a while.