Fig. 3
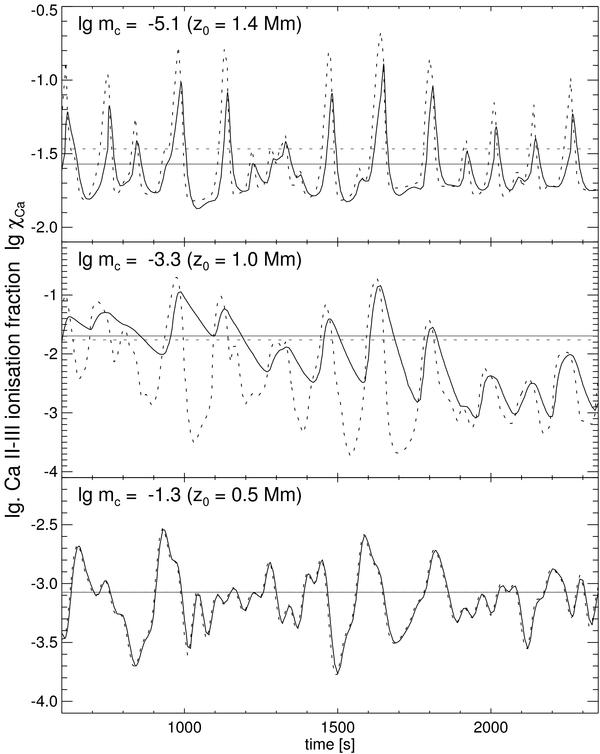
Logarithmic Ca ii-iii ionisation fraction as function of time at different Lagrangian locations. The labels refer to the corresponding geometric height in the initial atmosphere. The lines represent the results from the non-equilibrium simulation (solid) and for statistical equilibrium (dotted) calculated for the same values of the hydrodynamic variables. The horizontal lines are the corresponding time-averages.
Current usage metrics show cumulative count of Article Views (full-text article views including HTML views, PDF and ePub downloads, according to the available data) and Abstracts Views on Vision4Press platform.
Data correspond to usage on the plateform after 2015. The current usage metrics is available 48-96 hours after online publication and is updated daily on week days.
Initial download of the metrics may take a while.