Fig. 8
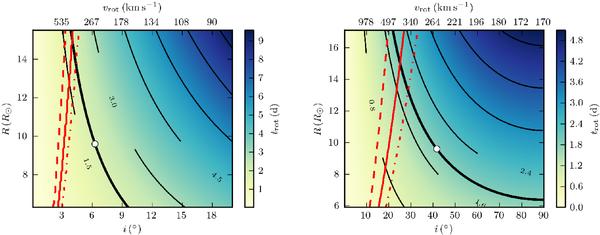
Possible i,R,vrot combinations in agreement with the observed vsini = 28 km s-1 of the primary (left) and the vsini = 170 km s-1 of the secondary component (right). Plots show (via colours and thin black curved contour lines) rotation periods calculated from the observed projected rotational velocities at given i,R values. The thick contour line corresponds to the main peak at 1.898 d from the frequency spectrum, and the dashed, continuous, and dot-dashed red lines show the break-up velocity (with speeds rising towards the left) for ℳmax, for ℳ, and for ℳmin, respectively. The thick contour line corresponds with the parameter-combinations that fit the hypothesis in Sect. 3.3, and the white dot shows the location of the most probable R (and thus i) value from Table 2.
Current usage metrics show cumulative count of Article Views (full-text article views including HTML views, PDF and ePub downloads, according to the available data) and Abstracts Views on Vision4Press platform.
Data correspond to usage on the plateform after 2015. The current usage metrics is available 48-96 hours after online publication and is updated daily on week days.
Initial download of the metrics may take a while.