Fig. 8
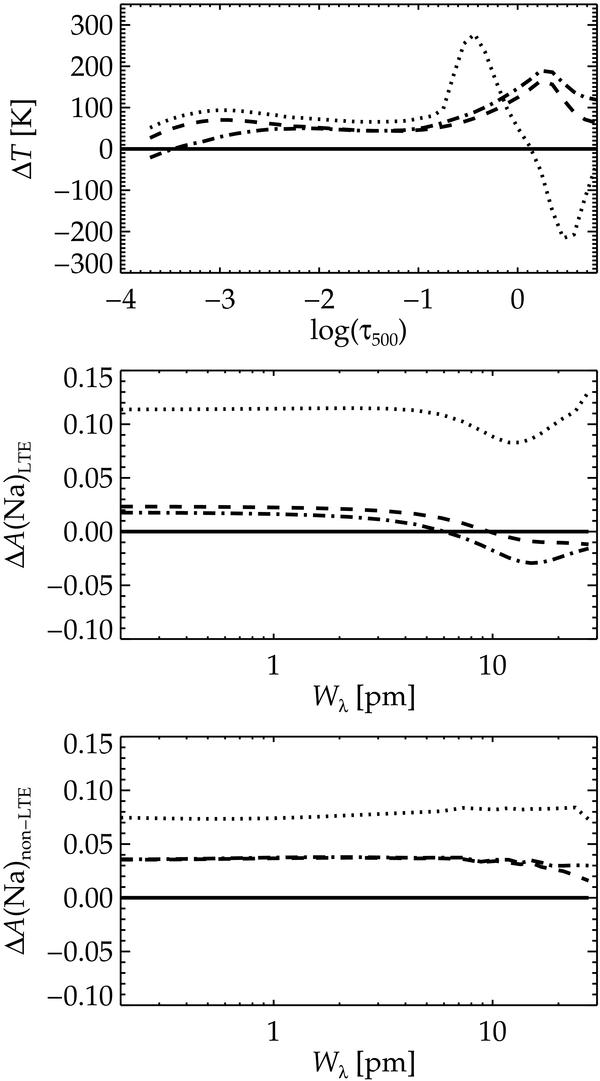
Top: temperature difference between atlas9 models with respect to marcs models (Gustafsson et al. 2008), for a metal-poor giant (Teff = 5000 K, log g = 2.0, [Fe/H] = −2.0, ξt = 2.0 km s-1). The dotted line represents an atlas9 model with scaled solar composition and convective overshoot from the Kurucz 1993-grid. The dashed line has the same composition, but without overshoot. The dashed-dotted line represents a 0.4 dex alpha-enhanced atlas9 model without overshoot from the 2004-grid by Castelli & Kurucz. Middle: difference between LTE abundance as function of line strength for the same models with respect to marcs. The abundances are based on the 819.4 nm Na I line and vary from left to right between [Na/Fe] = −2.0... +2.0. Bottom: same as the middle panel, but for non-LTE abundances.
Current usage metrics show cumulative count of Article Views (full-text article views including HTML views, PDF and ePub downloads, according to the available data) and Abstracts Views on Vision4Press platform.
Data correspond to usage on the plateform after 2015. The current usage metrics is available 48-96 hours after online publication and is updated daily on week days.
Initial download of the metrics may take a while.