Fig. 7
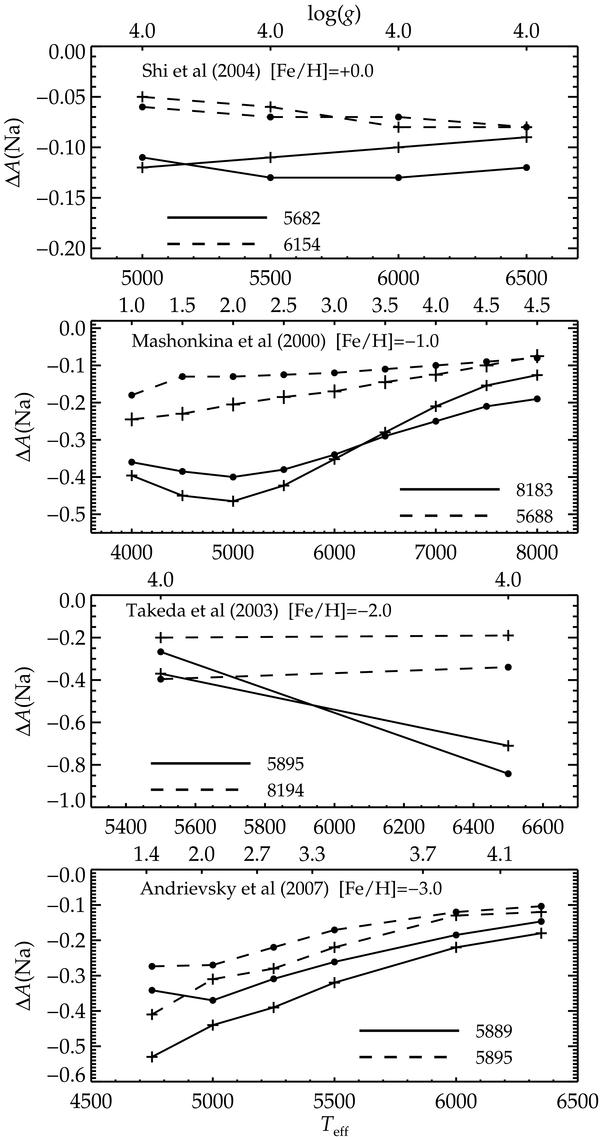
Comparison between the abundance corrections determined in this study (lines connected with bullets) and earlier studies, as indicated in each panel (lines connected with plus signs). Effective temperature is used as reference axis, with surface gravity values for each model indicated along the top axis of each panel. All calculations assumed [Na/Fe] = 0.0.
Current usage metrics show cumulative count of Article Views (full-text article views including HTML views, PDF and ePub downloads, according to the available data) and Abstracts Views on Vision4Press platform.
Data correspond to usage on the plateform after 2015. The current usage metrics is available 48-96 hours after online publication and is updated daily on week days.
Initial download of the metrics may take a while.