Free Access
Fig. 4
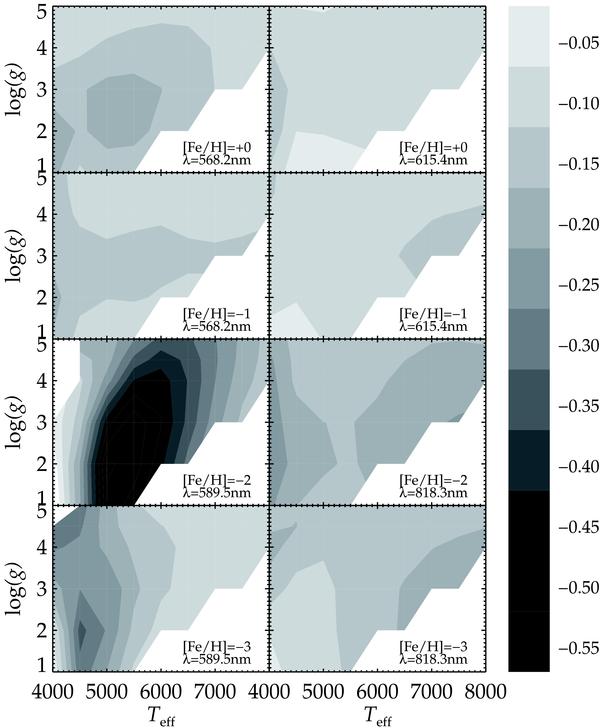
Contour diagrams illustrating how the abundance corrections vary with effective temperature and surface gravity for four commonly analysed lines of Na I. Only the results for ξ = 2 km s-1 and [Na/Fe] = 0 are shown.
Current usage metrics show cumulative count of Article Views (full-text article views including HTML views, PDF and ePub downloads, according to the available data) and Abstracts Views on Vision4Press platform.
Data correspond to usage on the plateform after 2015. The current usage metrics is available 48-96 hours after online publication and is updated daily on week days.
Initial download of the metrics may take a while.