Fig. 2
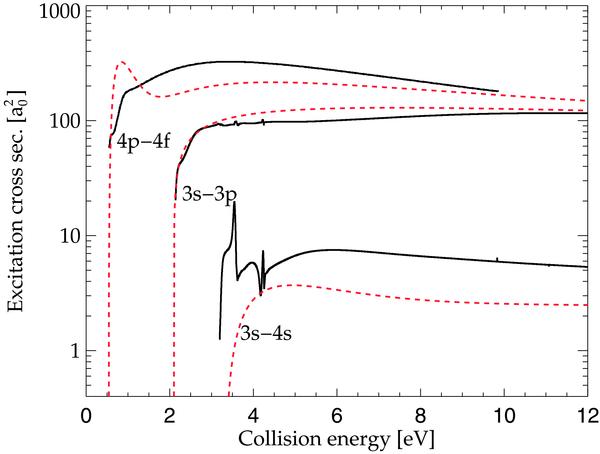
Three sample excitation cross-sections for collisions between Na I and electrons. The black solid lines represent R-matrix calculations (Feautrier et al. 2010; Gao et al. 2010) and the red dashed lines represent the analytical fitting functions derived by Igenbergs et al. (2008). The transitions are marked with labels next to the energy thresholds.
Current usage metrics show cumulative count of Article Views (full-text article views including HTML views, PDF and ePub downloads, according to the available data) and Abstracts Views on Vision4Press platform.
Data correspond to usage on the plateform after 2015. The current usage metrics is available 48-96 hours after online publication and is updated daily on week days.
Initial download of the metrics may take a while.