Free Access
Fig. 4
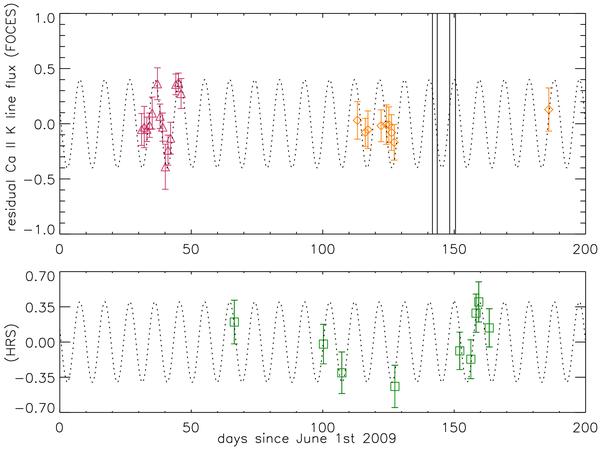
Time series of Ca ii residuals with the highest probability period (9.5 d) indicated by the dotted line; red triangles and orange diamonds are 15 μ and 24 μ data from FOCES, green boxes are scaled-down HRS data with the same periodicity indicated. Chandra observation dates are indicated by vertical solid lines.
Current usage metrics show cumulative count of Article Views (full-text article views including HTML views, PDF and ePub downloads, according to the available data) and Abstracts Views on Vision4Press platform.
Data correspond to usage on the plateform after 2015. The current usage metrics is available 48-96 hours after online publication and is updated daily on week days.
Initial download of the metrics may take a while.