Free Access
Fig. 2
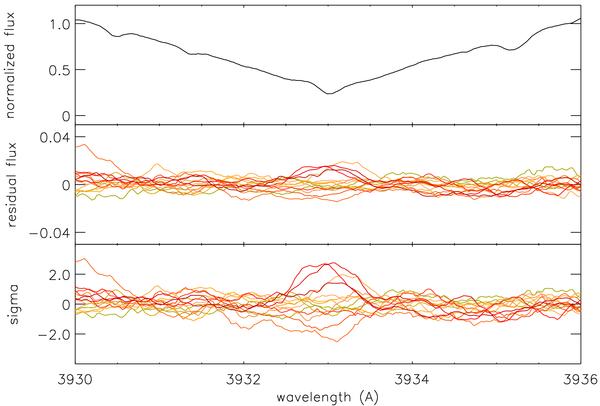
Variability in Ca ii K line cores of the FOCES 15 μ data. Upper panel: normalized mean spectrum; middle panel: residual flux with the same normalization; lower panel: flux variation in standard deviations.
Current usage metrics show cumulative count of Article Views (full-text article views including HTML views, PDF and ePub downloads, according to the available data) and Abstracts Views on Vision4Press platform.
Data correspond to usage on the plateform after 2015. The current usage metrics is available 48-96 hours after online publication and is updated daily on week days.
Initial download of the metrics may take a while.