Fig. 6
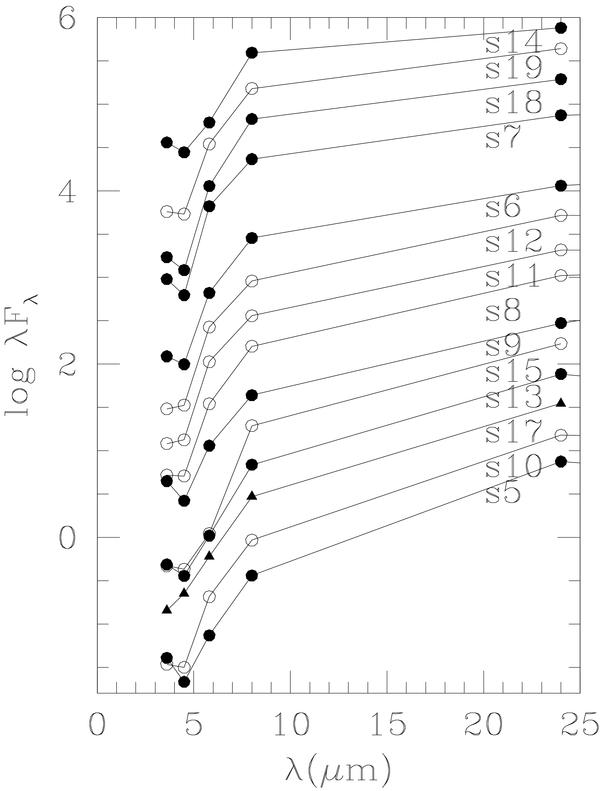
IRAC SEDs: sources with a large flux growth between 4.5 and at 8 μm. The plot shows the sources from bottom to top scaling the fluxes so that the source at the bottom is the one with the steepest slope between the 8 and the 24 μm flux, the source at the top is the one with the shallowest gradient. Effective flux values can be recovered from Table 1. Open dots are used for sources that do not show a noticeable decrease of the flux between 3.6 and 4.5 μm.
Current usage metrics show cumulative count of Article Views (full-text article views including HTML views, PDF and ePub downloads, according to the available data) and Abstracts Views on Vision4Press platform.
Data correspond to usage on the plateform after 2015. The current usage metrics is available 48-96 hours after online publication and is updated daily on week days.
Initial download of the metrics may take a while.