Fig. 4
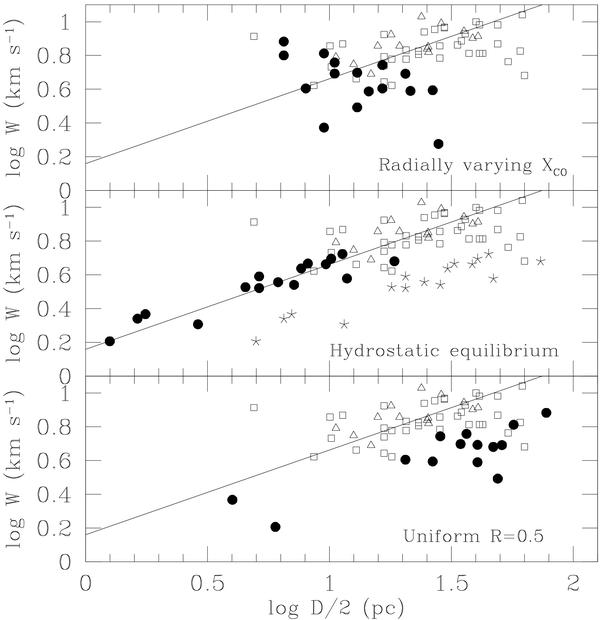
Fit to the size-linewidth relation for the Milky Way and M 33 spatially resolved molecular clouds (solid line). The open symbols are for GMCs observed in M 33 by Rosolowsky et al. (2003) (open squares) and by Wilson & Scoville (1990) (open triangles). The filled circles are molecular clouds associated to our HII regions. Sizes were computed according to the uniform intrinsic line ratio in the bottom panel and to the radially varying XCO model in the top panel. In the middle panel asterisks indicate the maximum cloud size for hydrostatic equilibrium models and filled circles the core sizes, which are 0.25 of the maximum size. This scaling minimizes the scatter around the size-linewidth relation. The linewidths used are the CO J = 1–0 linewidth in the bottom panel and are given in Tables 5 and 6 for the other two panels.
Current usage metrics show cumulative count of Article Views (full-text article views including HTML views, PDF and ePub downloads, according to the available data) and Abstracts Views on Vision4Press platform.
Data correspond to usage on the plateform after 2015. The current usage metrics is available 48-96 hours after online publication and is updated daily on week days.
Initial download of the metrics may take a while.