Fig. 2
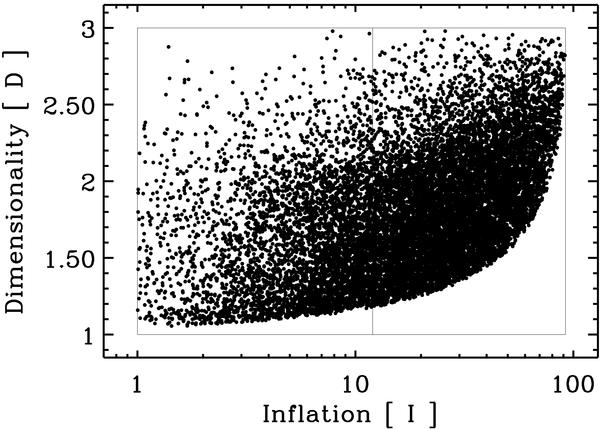
Dimensionality, D, versus inflation, I, plot for particles containing 50 equal-sized constituents for ≈15 000 randomly-generated structures (with φ = 1). The inset box shows the limits on D (1 ≤ D ≤ 3) and I (1 ≤ I ≤ N2/27), and the middle vertical line shows the limit for an idealised 2D particle, i.e., I = N/4.
Current usage metrics show cumulative count of Article Views (full-text article views including HTML views, PDF and ePub downloads, according to the available data) and Abstracts Views on Vision4Press platform.
Data correspond to usage on the plateform after 2015. The current usage metrics is available 48-96 hours after online publication and is updated daily on week days.
Initial download of the metrics may take a while.