Fig. 9
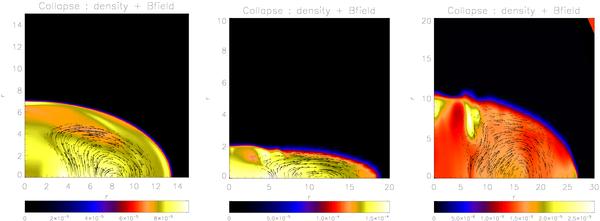
Evolution of the toy collapse model. Panels show the rest mass density and the mangetic field lines (represented by arrows) at three different instants of the evolution. Left panel: t = 50, initial aspherical collapse. Note that the star is collapsing along the axis but expanding at the equator. Middle panel: t = 100, bounce. Right panel: t = 200, later expansion.

Current usage metrics show cumulative count of Article Views (full-text article views including HTML views, PDF and ePub downloads, according to the available data) and Abstracts Views on Vision4Press platform.
Data correspond to usage on the plateform after 2015. The current usage metrics is available 48-96 hours after online publication and is updated daily on week days.
Initial download of the metrics may take a while.