Fig. 6
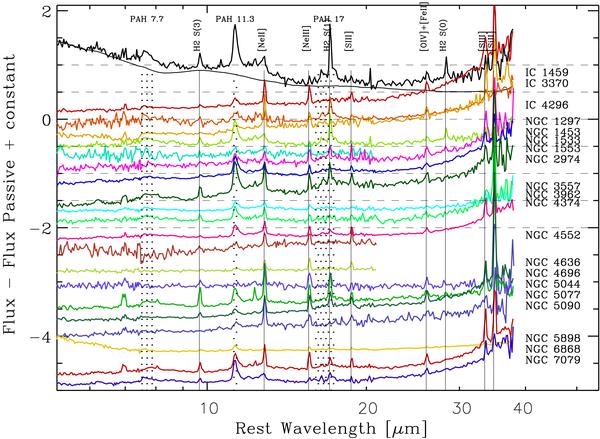
Class-2 ETGs, i.e. those showing prominent ionic emission lines and “unusual” PAH emission, mainly dominated by the 11.3 μm complex. We show the residuals after the subtraction of the average passive ETG spectrum (thick black line) as in Fig. 5. In some galaxies the broad 10 μm silicon emission is still visible (see Fig. 1). At the top of the figure we superpose the spectrum of NGC 1297 on the passive template. H2 molecular rotational lines are detected in some objects. Fluxes have been arbitrary scaled in order to separate the spectra.
Current usage metrics show cumulative count of Article Views (full-text article views including HTML views, PDF and ePub downloads, according to the available data) and Abstracts Views on Vision4Press platform.
Data correspond to usage on the plateform after 2015. The current usage metrics is available 48-96 hours after online publication and is updated daily on week days.
Initial download of the metrics may take a while.