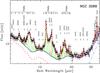
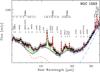
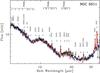
Fig. 3

Upper panel: detailed fit of the MIR spectrum of a typical ETG with normal PAH emission. Open squares and the solid thick red line are the observed MIR spectra and our final best fit, respectively. The fit is calculated as the sum of an underlying continuum (solid thick blue line), the PAH features (solid thin green line) and the emission lines (solid thin orange line). The two components of the continuum, old stellar population (dashed line) and diffuse dust emission (dot-dashed line), are also plotted. Middle panel: as before but for an ETG with unusual PAH emission. Bottom panel: as before but for an ETG showing only line emission.
Current usage metrics show cumulative count of Article Views (full-text article views including HTML views, PDF and ePub downloads, according to the available data) and Abstracts Views on Vision4Press platform.
Data correspond to usage on the plateform after 2015. The current usage metrics is available 48-96 hours after online publication and is updated daily on week days.
Initial download of the metrics may take a while.