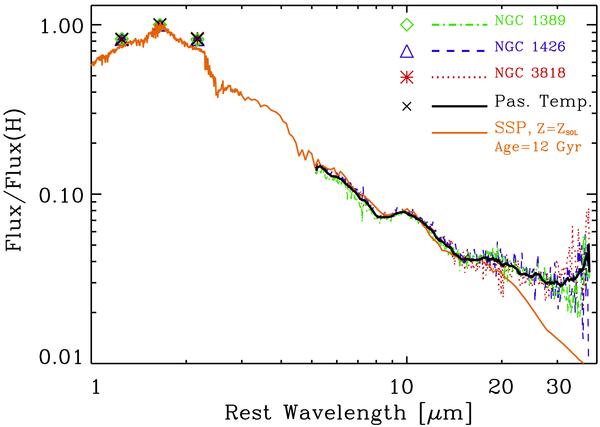
Fig. 2

The passive template adopted in this paper (black solid line, and black crosses in the plot), is compared with the IRS-Spitzer spectra (lines) of the three galaxies used to build it, and with an SSP of solar metallicity and age of 12 Gyr. The spectra, at the rest wavelength, are normalized to the H-band. The 2MASS H, J, K-bands fluxes of the three galaxies, within the central 5″ radius, are indicated with symbols in the top left of the plot. At wavelengths longer than ≈ 30 μm there is a residual contribution of diffuse warm dust which does not affect our analysis (see text).
Current usage metrics show cumulative count of Article Views (full-text article views including HTML views, PDF and ePub downloads, according to the available data) and Abstracts Views on Vision4Press platform.
Data correspond to usage on the plateform after 2015. The current usage metrics is available 48-96 hours after online publication and is updated daily on week days.
Initial download of the metrics may take a while.


