Free Access
Fig. 11
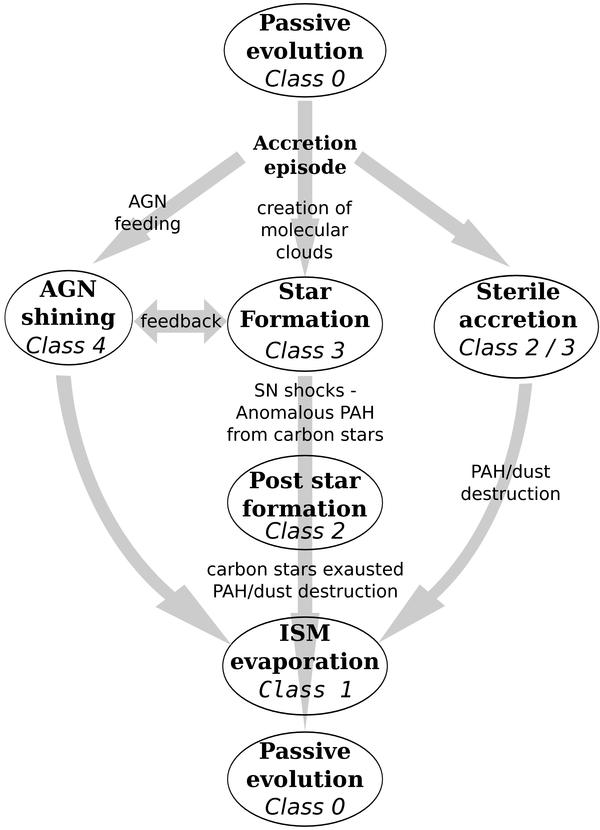
Schematic representation of the evolutionary path triggered by a perturbation/accretion event. The labels in bold show the physical phases, while labels in italics show the associated MIR class; arrows show the paths that an ETG can follow.
Current usage metrics show cumulative count of Article Views (full-text article views including HTML views, PDF and ePub downloads, according to the available data) and Abstracts Views on Vision4Press platform.
Data correspond to usage on the plateform after 2015. The current usage metrics is available 48-96 hours after online publication and is updated daily on week days.
Initial download of the metrics may take a while.