Free Access
Fig. 8
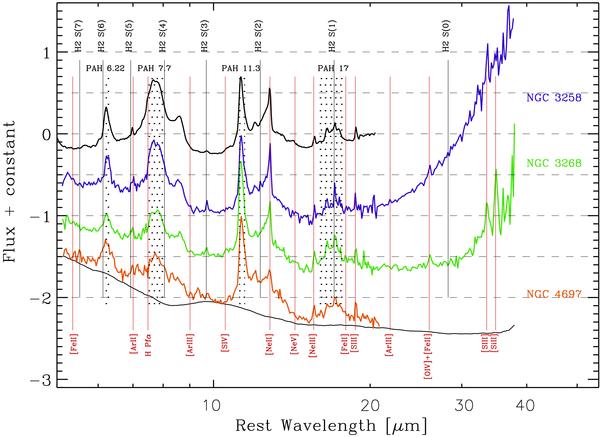
ETGs showing “normal” PAH features – Class-3. For comparison, at the top of the plot we show the spectrum of the fading starburst NGC 4435 (see Bressan et al. 2006; Panuzzo et al. 2007) and at the bottom the passive template. Fluxes have been arbitrary scaled in order to separate the spectra.
Current usage metrics show cumulative count of Article Views (full-text article views including HTML views, PDF and ePub downloads, according to the available data) and Abstracts Views on Vision4Press platform.
Data correspond to usage on the plateform after 2015. The current usage metrics is available 48-96 hours after online publication and is updated daily on week days.
Initial download of the metrics may take a while.