Fig. 1
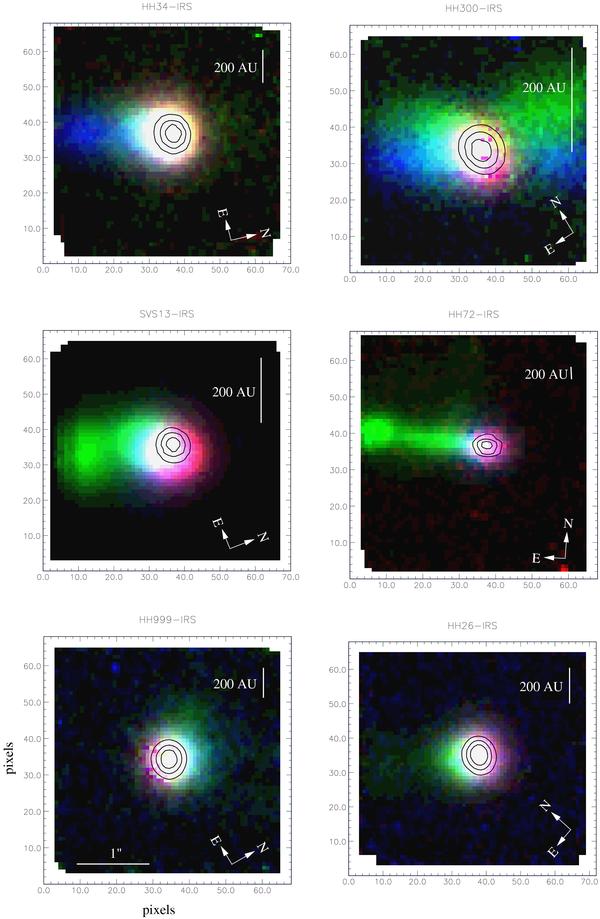
Colour figures constructed from continuum-subtracted [Fe ii] 1.644 μm (blue), H2 2.122 μm (green) and Brγ 2.166 μm (red) images. The three images in each panel are scaled between the 10th and 95th percentile (consequently, regions where each line peaks tend to appear white). Contours of the continuum emission at 2.16 μm (i.e. adjacent to Brγ) are over-plotted at 50%, 75% and 90% the peak flux. Offsets are arbitrary and are in pixels. The horizontal axis in each panel is aligned with the nominal flow direction (listed in Table 1).
Current usage metrics show cumulative count of Article Views (full-text article views including HTML views, PDF and ePub downloads, according to the available data) and Abstracts Views on Vision4Press platform.
Data correspond to usage on the plateform after 2015. The current usage metrics is available 48-96 hours after online publication and is updated daily on week days.
Initial download of the metrics may take a while.