Fig. 8
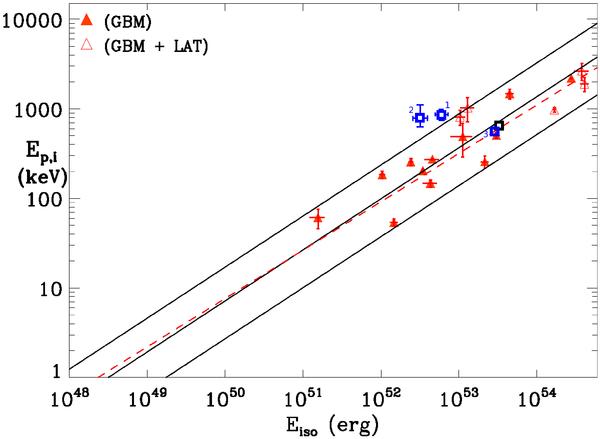
The three emission episodes indicated as blue squares in the Epeak,rest–Eiso plane. The black square shows the “summed” position of GRB 091024, obtained using time-integrated quantities (see text for details). Red triangles indicate long GBM GRBs as presented in Amati (2010) together with the best fit to this data (dashed red line). The black solid line shows the best-fit power-law, known as the “Amati relation” together with the ± 2σ c.l. region (Amati et al. 2008).
Current usage metrics show cumulative count of Article Views (full-text article views including HTML views, PDF and ePub downloads, according to the available data) and Abstracts Views on Vision4Press platform.
Data correspond to usage on the plateform after 2015. The current usage metrics is available 48-96 hours after online publication and is updated daily on week days.
Initial download of the metrics may take a while.