Free Access
Fig. 7
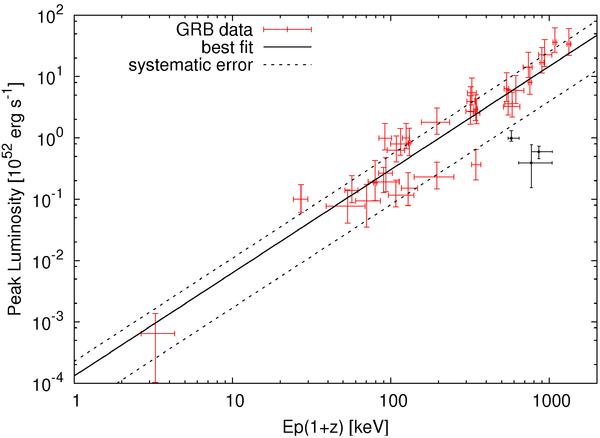
Peak luminosity, Lp, and rest frame peak energy, Epeak,rest. Figure adapted from Kodama et al. (2008). Red dots show 33 GRBs with z < 1.62. The solid line shows the fit to the red data points, the dashed lines show the systematic error. Black dots are the values for the three emission epochs in GRB 091024.
Current usage metrics show cumulative count of Article Views (full-text article views including HTML views, PDF and ePub downloads, according to the available data) and Abstracts Views on Vision4Press platform.
Data correspond to usage on the plateform after 2015. The current usage metrics is available 48-96 hours after online publication and is updated daily on week days.
Initial download of the metrics may take a while.