Free Access
Fig. 6
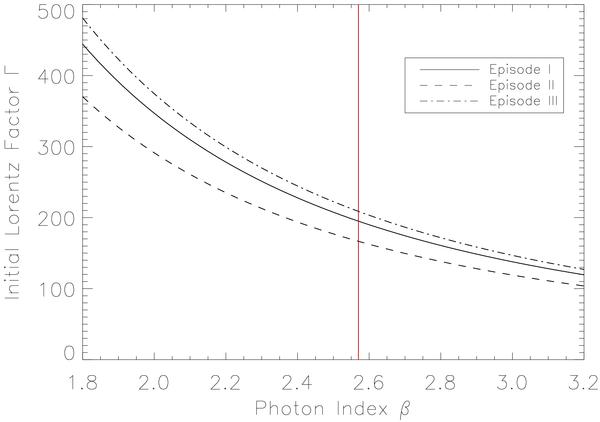
Deduced lower limit of Γ0 as a function of the photon index β using Lithwick & Sari (2001) for episode I at t0 (continuous line), episode II at t0+630 s (dashed line) and episode III at t0+830 s (dashed-dotted line). The red vertical line indicates the photon index of the Band model of the first emission epoch.
Current usage metrics show cumulative count of Article Views (full-text article views including HTML views, PDF and ePub downloads, according to the available data) and Abstracts Views on Vision4Press platform.
Data correspond to usage on the plateform after 2015. The current usage metrics is available 48-96 hours after online publication and is updated daily on week days.
Initial download of the metrics may take a while.