Free Access
Fig. 5
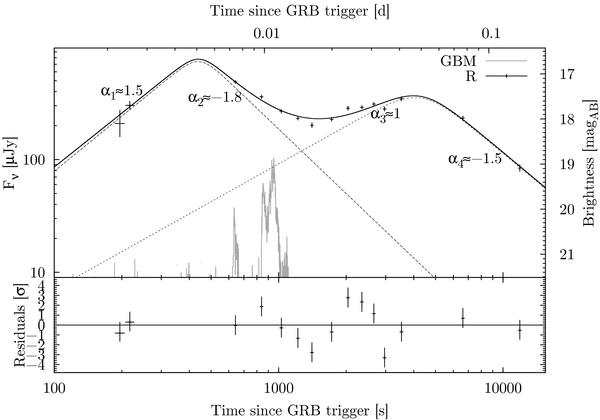
Combined r-band light curve using data points from Henden et al. (2009); Cano et al. (2009); Updike et al. (2009). The dashed line shows a reverse shock/forward shock modeling. The GBM light curve is presented in counts/s to guide the eye. Swift-XRT started observing 3000 s after the GBM trigger.
Current usage metrics show cumulative count of Article Views (full-text article views including HTML views, PDF and ePub downloads, according to the available data) and Abstracts Views on Vision4Press platform.
Data correspond to usage on the plateform after 2015. The current usage metrics is available 48-96 hours after online publication and is updated daily on week days.
Initial download of the metrics may take a while.