Free Access
Fig. 4
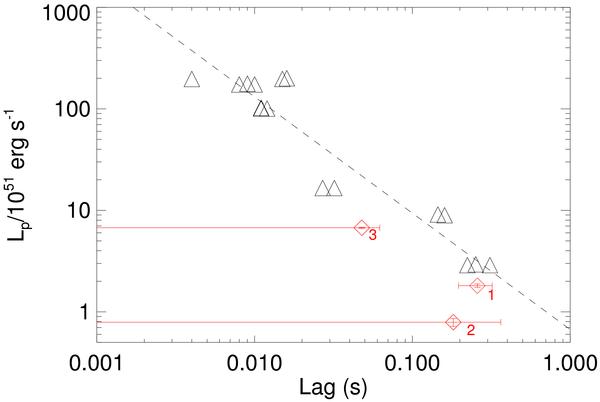
Spectral lag versus peak luminosity (50–300 keV). Red diamonds indicate the position of the 3 emission episodes of GRB 091024. Black triangles show pulses of other long GRBs presented in Norris et al. (2000b).
Current usage metrics show cumulative count of Article Views (full-text article views including HTML views, PDF and ePub downloads, according to the available data) and Abstracts Views on Vision4Press platform.
Data correspond to usage on the plateform after 2015. The current usage metrics is available 48-96 hours after online publication and is updated daily on week days.
Initial download of the metrics may take a while.