Fig. 8
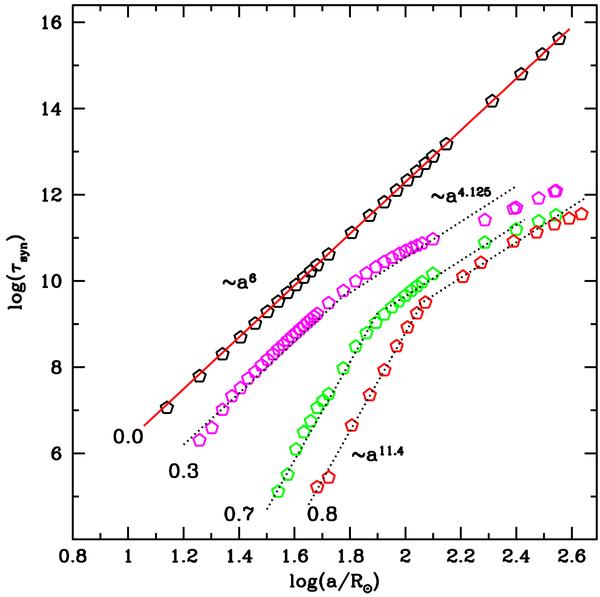
Synchronization from the energy dissipation rates computed with our model using a
kinematical viscosity  d-1
and Eq. (36). The different
“families” are labeled by their corresponding eccentricity. The solid line is the
synchronization timescale from Zahn’s (2008)
relation, assuming a constant density structure and
⟨ ν ⟩ = 1.4 × 1012 cm2 s-1.
This relation is valid only for e ~ 0.0. The dotted lines
illustrate the trends for higher eccentricities from our computed models. Note that
τsyn ~ a4.125 for
high value of e and a.
τsyn is in units of years.
d-1
and Eq. (36). The different
“families” are labeled by their corresponding eccentricity. The solid line is the
synchronization timescale from Zahn’s (2008)
relation, assuming a constant density structure and
⟨ ν ⟩ = 1.4 × 1012 cm2 s-1.
This relation is valid only for e ~ 0.0. The dotted lines
illustrate the trends for higher eccentricities from our computed models. Note that
τsyn ~ a4.125 for
high value of e and a.
τsyn is in units of years.
Current usage metrics show cumulative count of Article Views (full-text article views including HTML views, PDF and ePub downloads, according to the available data) and Abstracts Views on Vision4Press platform.
Data correspond to usage on the plateform after 2015. The current usage metrics is available 48-96 hours after online publication and is updated daily on week days.
Initial download of the metrics may take a while.