Fig. 7
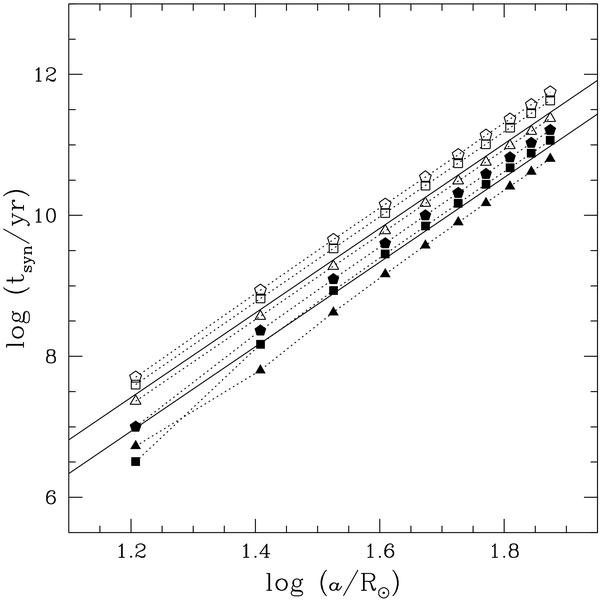
Synchronization time computed with Eq. (33) using the results given in Fig. 3. The meaning of symbols stays the same as in Fig. 3. The continuous lines are the theoretical result obtained by
using Eq. (2.5) from Zahn (2008), under the
assumption of a uniform density structure ( ), and with
⟨ ν ⟩ = 3.4 × 1012 cm2 s-1.
The top line is for β0 = 1.2 and the bottom one for
β = 2.0.
), and with
⟨ ν ⟩ = 3.4 × 1012 cm2 s-1.
The top line is for β0 = 1.2 and the bottom one for
β = 2.0.
Current usage metrics show cumulative count of Article Views (full-text article views including HTML views, PDF and ePub downloads, according to the available data) and Abstracts Views on Vision4Press platform.
Data correspond to usage on the plateform after 2015. The current usage metrics is available 48-96 hours after online publication and is updated daily on week days.
Initial download of the metrics may take a while.