Fig. 5
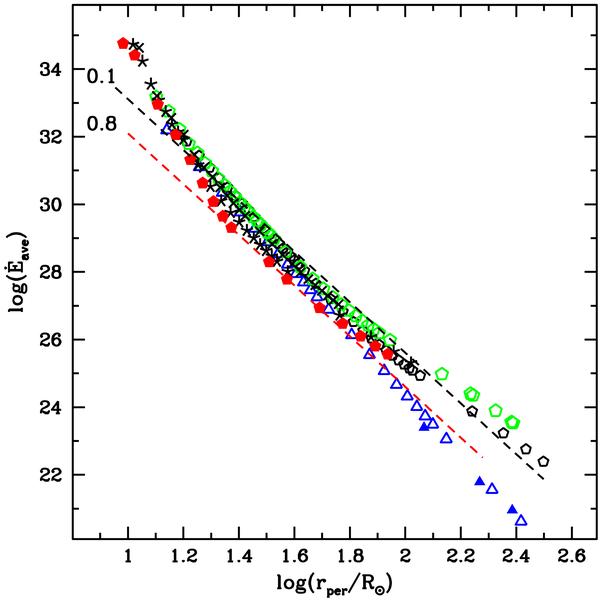
Energy dissipation rates of the previous figure but here plotted as a function of the periastron distance, rper. In this representation, the different curves for each eccentricity “collapse” onto a common region. The dashed lines show the absolute value of Ėorb given by Eq. (A31) of Hut (1981) for e = 0.1 and 0.8, also plotted as a function of rper. Symbols correspond to the different eccentricities: e = 0.00 (open triangles), 0.01 (filled triangles), 0.10 (small pentagons), 0.30 (large pentagons), 0.50 (crosses), 0.70 (stars) and 0.8 (filled pentagons).
Current usage metrics show cumulative count of Article Views (full-text article views including HTML views, PDF and ePub downloads, according to the available data) and Abstracts Views on Vision4Press platform.
Data correspond to usage on the plateform after 2015. The current usage metrics is available 48-96 hours after online publication and is updated daily on week days.
Initial download of the metrics may take a while.