Fig. 9
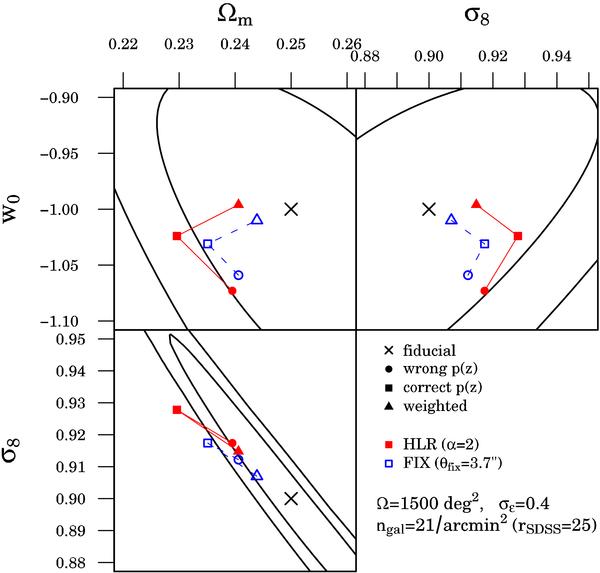
Likelihood analysis of the bias caused by the removal of blended galaxies. Each panel shows the 1- and 2σ confidence contours obtained by marginalizing over the remaining parameter (computed for the HLR criterion with α = 2 and  ). The fiducial parameter values are marked with crosses. Circles indicate the maximum likelihood estimates assuming that the true redshift distribution after object selection is unknown, squares show the maxima if the correct p(z) is used, and triangles give the estimates after applying the weighting scheme of Sect. 5. For the HLR criterion (α = 2; ), filled symbols have been used, open symbols for the FIX criterion with θfix = 3.7′′. For better visibility, the estimates for each criterion type have been connected with a line.
Current usage metrics show cumulative count of Article Views (full-text article views including HTML views, PDF and ePub downloads, according to the available data) and Abstracts Views on Vision4Press platform.
Data correspond to usage on the plateform after 2015. The current usage metrics is available 48-96 hours after online publication and is updated daily on week days.
Initial download of the metrics may take a while.