Fig. 3
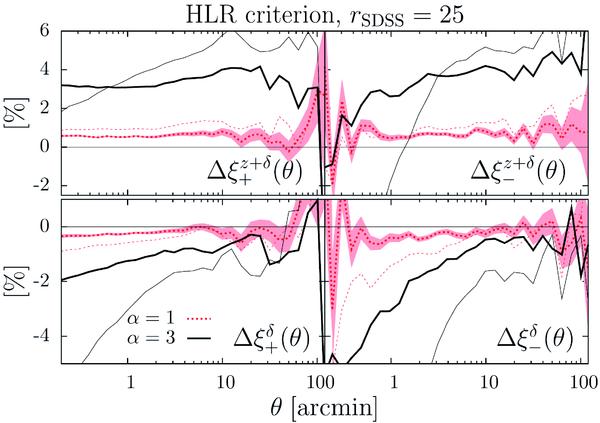
Fractional bias of the shear correlation functions for the HLR criterion, without (upper panels) and with (lower panels) correction for the change of the redshift distribution. Thick dashed lines are for α = 1, thick solid lines for α = 3 without seeing. For the respective thin lines a seeing of  was assumed. The shaded region shows the 1σ-error. For better visibility, it is shown only for the case of α = 3, θsee = 0′′. The error bars for the other cases are very similar.
Current usage metrics show cumulative count of Article Views (full-text article views including HTML views, PDF and ePub downloads, according to the available data) and Abstracts Views on Vision4Press platform.
Data correspond to usage on the plateform after 2015. The current usage metrics is available 48-96 hours after online publication and is updated daily on week days.
Initial download of the metrics may take a while.