Free Access
Fig. 6
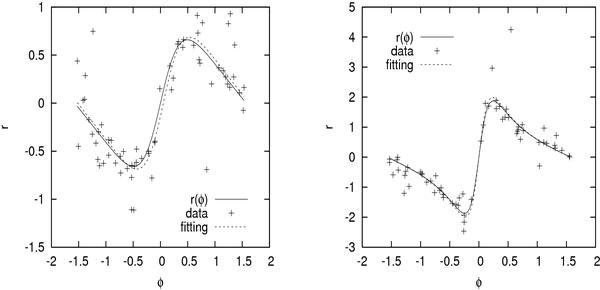
The flexion ratio r varies with φ. The dashed line is for an SIE halo model. The points are calculated from the simulated data, the dotted line is the fit to the results with Eq. (9). Left is a halo with ϵ = 0.3, and right is ϵ = 0.6.
This figure is made of several images, please see below:
Current usage metrics show cumulative count of Article Views (full-text article views including HTML views, PDF and ePub downloads, according to the available data) and Abstracts Views on Vision4Press platform.
Data correspond to usage on the plateform after 2015. The current usage metrics is available 48-96 hours after online publication and is updated daily on week days.
Initial download of the metrics may take a while.