Fig. 3
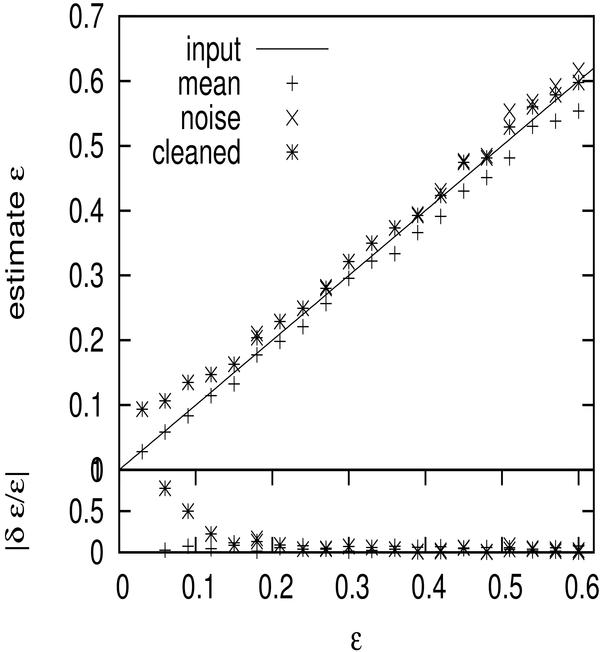
Top panel: comparison of the input ellipticity (solid line) and the estimate (similar as Fig. 2). The plus points show the average estimate for 20 realizations without noise. The other are the result from data with intrinsic noise. All the result are calculated from Eq. (14). The stars are calculated when flexion ratios higher than the upper limit (Eq. (11)) are excluded. Bottom panel: fractional error |δϵ/ϵ| of our estimate for the respective cases.
Current usage metrics show cumulative count of Article Views (full-text article views including HTML views, PDF and ePub downloads, according to the available data) and Abstracts Views on Vision4Press platform.
Data correspond to usage on the plateform after 2015. The current usage metrics is available 48-96 hours after online publication and is updated daily on week days.
Initial download of the metrics may take a while.