Fig. 1
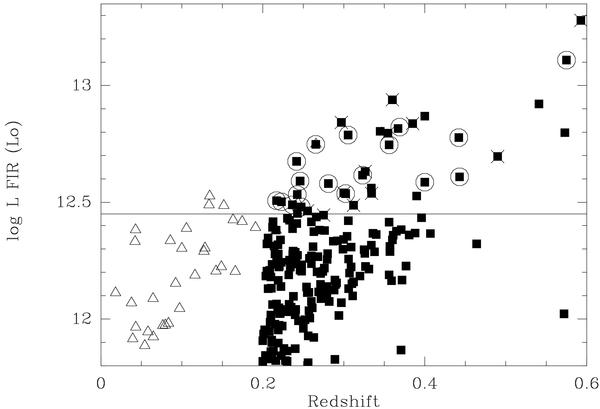
Definition of our sample. Among the 209 northern galaxies (filled symbols) found in NED between 0.2 < z < 0.6 and detected at 60 μm by IRAS, we selected the most luminous ones (log LFIR/L⊙ > 12.45, as indicated by the horizontal line). By comparison, the ULIRGs in the sample of Solomon et al. (1997) are plotted as open triangles. The circles indicate detections, non-detections are marked by a cross. Sources that have neither a circle nor a cross could not be observed due to weather conditions.
Current usage metrics show cumulative count of Article Views (full-text article views including HTML views, PDF and ePub downloads, according to the available data) and Abstracts Views on Vision4Press platform.
Data correspond to usage on the plateform after 2015. The current usage metrics is available 48-96 hours after online publication and is updated daily on week days.
Initial download of the metrics may take a while.