Free Access
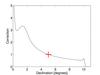
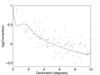
Fig. 8

Left panel: correction factor as function of declination, to be applied on the obtained fluxes. Right panel: correcting factor on a logarithmic scales with data points representing the flux ratio between WVFS total-power and cross-correlation data, before applying the correction on the cross-correlation data.
This figure is made of several images, please see below:
Current usage metrics show cumulative count of Article Views (full-text article views including HTML views, PDF and ePub downloads, according to the available data) and Abstracts Views on Vision4Press platform.
Data correspond to usage on the plateform after 2015. The current usage metrics is available 48-96 hours after online publication and is updated daily on week days.
Initial download of the metrics may take a while.