Fig. 6
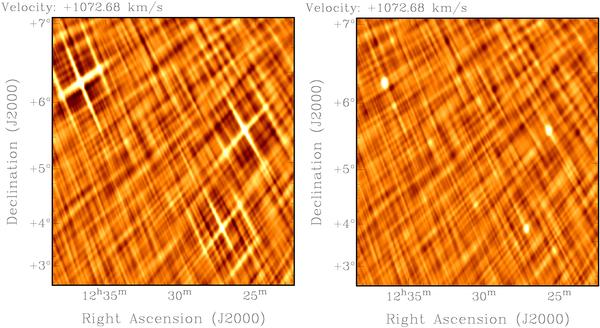
The left panel shows a region of the dirty map; data that has only been inverted from the u,v plane to the image plane. The right panel shows exactly the same region after one pass of cleaning. While in the left panel the cross pattern of the beam is very apparent, in the right panel the side-lobes are almost completely subtracted.
Current usage metrics show cumulative count of Article Views (full-text article views including HTML views, PDF and ePub downloads, according to the available data) and Abstracts Views on Vision4Press platform.
Data correspond to usage on the plateform after 2015. The current usage metrics is available 48-96 hours after online publication and is updated daily on week days.
Initial download of the metrics may take a while.