Free Access
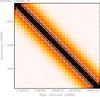
Fig. 5
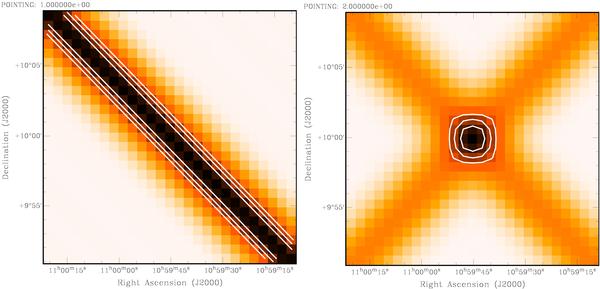
Beam shape of a central pointing in the strip at Dec = 10 degrees. The left panel shows the synthesized beam of a single observation, while the right panel shows the beam for the combination of two complimentary scans. Both panels have the same intensity scale and contours are drawn at 70, 80 and 90 percent of the peak.
This figure is made of several images, please see below:
Current usage metrics show cumulative count of Article Views (full-text article views including HTML views, PDF and ePub downloads, according to the available data) and Abstracts Views on Vision4Press platform.
Data correspond to usage on the plateform after 2015. The current usage metrics is available 48-96 hours after online publication and is updated daily on week days.
Initial download of the metrics may take a while.