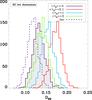
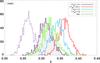
Fig. 4

Distribution of V (top) and DKS (bottom) from 1000 Monte Carlo realisation 1000 simulated events with energy above 60 EeV. Mean source density ns = 10-3 Mpc-3. The dotted curves represent the isotropic model, the hatched curves denote the LSS model and from right to left we have ⟨ τ ⟩ 100 = 0.1, ⟨ τ ⟩ 100 = 1, and ⟨ τ ⟩ 100 = 3.
Current usage metrics show cumulative count of Article Views (full-text article views including HTML views, PDF and ePub downloads, according to the available data) and Abstracts Views on Vision4Press platform.
Data correspond to usage on the plateform after 2015. The current usage metrics is available 48-96 hours after online publication and is updated daily on week days.
Initial download of the metrics may take a while.