Fig. 1
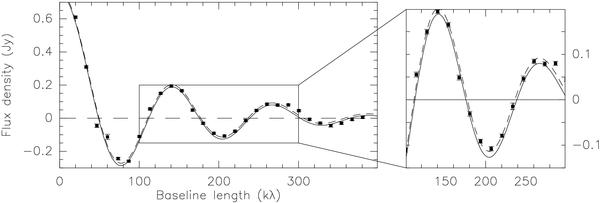
Real part of the visibility vs. baseline lengths. The points and error bars represent the measured values, and the curves are the best fits of a geometrical ring (plain curve; see Table 1) and of a ring plus a point source (dashed). The visibilities have been corrected from the disk orientation (PA = 7°) and inclination (i = 37°) by compressing the V value by cos(i) prior to circular averaging.
Current usage metrics show cumulative count of Article Views (full-text article views including HTML views, PDF and ePub downloads, according to the available data) and Abstracts Views on Vision4Press platform.
Data correspond to usage on the plateform after 2015. The current usage metrics is available 48-96 hours after online publication and is updated daily on week days.
Initial download of the metrics may take a while.